This site uses cookies to improve your experience. To help us insure we adhere to various privacy regulations, please select your country/region of residence. If you do not select a country, we will assume you are from the United States. Select your Cookie Settings or view our Privacy Policy and Terms of Use.
Cookie Settings
Cookies and similar technologies are used on this website for proper function of the website, for tracking performance analytics and for marketing purposes. We and some of our third-party providers may use cookie data for various purposes. Please review the cookie settings below and choose your preference.
Used for the proper function of the website
Used for monitoring website traffic and interactions
Cookie Settings
Cookies and similar technologies are used on this website for proper function of the website, for tracking performance analytics and for marketing purposes. We and some of our third-party providers may use cookie data for various purposes. Please review the cookie settings below and choose your preference.
Strictly Necessary: Used for the proper function of the website
Performance/Analytics: Used for monitoring website traffic and interactions
We use some of the data for training and some for testing (we will not use test data for training). How we do this is the subject of the concept of cross-validation. I will develop a model using the training data (blue) and apply it to my test data (red). Diagram of k-fold cross-validation.
The torchvision package includes datasets and transformations for testing and validating computer vision models. Scikit-learn Scikit-learn is a versatile Python library that offers various algorithms and model evaluation metrics, including cross-validation and grid search for hyperparameter tuning.
Summary : This article equips Data Analysts with a solid foundation of key Data Science terms, from A to Z. Introduction In the rapidly evolving field of Data Science, understanding key terminology is crucial for Data Analysts to communicate effectively, collaborate effectively, and drive data-driven projects.
No Problem: Using DBSCAN for Outlier Detection and Data Cleaning Photo by Mel Poole on Unsplash DBSCAN stands for Density-Based Spatial Clustering of Applications with Noise. DBSCAN works by partitioning the data into dense regions of points that are separated by less dense areas.
Pandas: A powerful library for data manipulation and analysis, offering data structures and operations for manipulating numerical tables and time series data. Scikit-learn: A simple and efficient tool for datamining and data analysis, particularly for building and evaluating machine learning models.
Scikit-Learn Scikit Learn is associated with NumPy and SciPy and is one of the best libraries helpful for working with complex data. Its modified feature includes the cross-validation that allowing it to use more than one metric. NumPy NumPy is one of the most popular Python Libraries for Machine Learning in Python.
Image from "Big Data Analytics Methods" by Peter Ghavami Here are some critical contributions of data scientists and machine learning engineers in health informatics: Data Analysis and Visualization: Data scientists and machine learning engineers are skilled in analyzing large, complex healthcare datasets.
Once the data is acquired, it is maintained by performing data cleaning, data warehousing, data staging, and data architecture. Data processing does the task of exploring the data, mining it, and analyzing it which can be finally used to generate the summary of the insights extracted from the data.
Scikit-learn Scikit-learn is a machine learning library in Python that is majorly used for datamining and data analysis. It also provides tools for model evaluation , including cross-validation, hyperparameter tuning, and metrics such as accuracy, precision, recall, and F1-score.
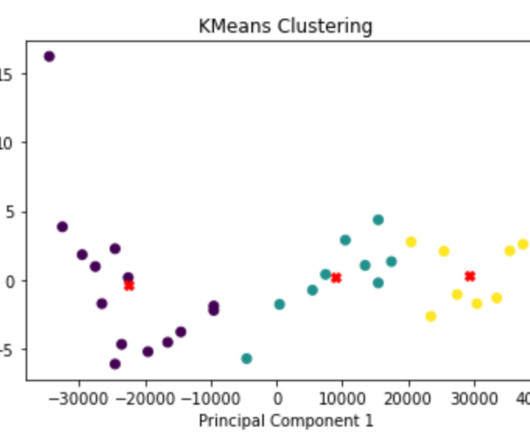
Originally used in DataMining, clustering can also serve as a crucial preprocessing step in various Machine Learning algorithms. The optimal value for K can be found using ideas like CrossValidation (CV). How would we tackle this challenge? K = 3 ; 3 Clusters. K = No of clusters.
Several datamining and neural network techniques have been employed to gauge the severity of heart disease but the prediction of it is a different subject. Ensuring that hybrid models also generalize well to unseen data is a constant concern. Techniques like cross-validation and robust evaluation methods are crucial.
We organize all of the trending information in your field so you don't have to. Join 17,000+ users and stay up to date on the latest articles your peers are reading.
You know about us, now we want to get to know you!
Let's personalize your content
Let's get even more personalized
We recognize your account from another site in our network, please click 'Send Email' below to continue with verifying your account and setting a password.
Let's personalize your content