This site uses cookies to improve your experience. To help us insure we adhere to various privacy regulations, please select your country/region of residence. If you do not select a country, we will assume you are from the United States. Select your Cookie Settings or view our Privacy Policy and Terms of Use.
Cookie Settings
Cookies and similar technologies are used on this website for proper function of the website, for tracking performance analytics and for marketing purposes. We and some of our third-party providers may use cookie data for various purposes. Please review the cookie settings below and choose your preference.
Used for the proper function of the website
Used for monitoring website traffic and interactions
Cookie Settings
Cookies and similar technologies are used on this website for proper function of the website, for tracking performance analytics and for marketing purposes. We and some of our third-party providers may use cookie data for various purposes. Please review the cookie settings below and choose your preference.
Strictly Necessary: Used for the proper function of the website
Performance/Analytics: Used for monitoring website traffic and interactions
Enter the DataAnalysis Agent, to automate analytical tasks, execute code, and adaptively respond to data queries. LangGraph, CrewAI, and AutoGen […] The post LangChain vs CrewAI vs AutoGen to Build a DataAnalysis Agent appeared first on Analytics Vidhya.
With just a few lines of code, you can tap into the vast knowledge […] The post Revamp DataAnalysis: OpenAI, LangChain & LlamaIndex for Easy Extraction appeared first on Analytics Vidhya.
However, with the right approach and tools, transforming data into meaningful knowledge is an immensely rewarding experience. In this guide, we will walk you through a typical academic dataanalysis workflow, […] The post Guide to Academic DataAnalysis With Julius AI appeared first on Analytics Vidhya.
Data literate: Users have a comfort level of working with, manipulating, analyzing, and visualizing data. Data aware: Users can combine past experiences, intuition, judgment, and qualitative inputs and dataanalysis to make decisions. Download the eBook to learn about How to Build Data Experiences for End Users.
Now, imagine a world where […] The post All About AI-powered DataAnalysis with Vizly appeared first on Analytics Vidhya. It has become a part of every major sector, from tech and healthcare to finance and entertainment, and continues transforming our work.
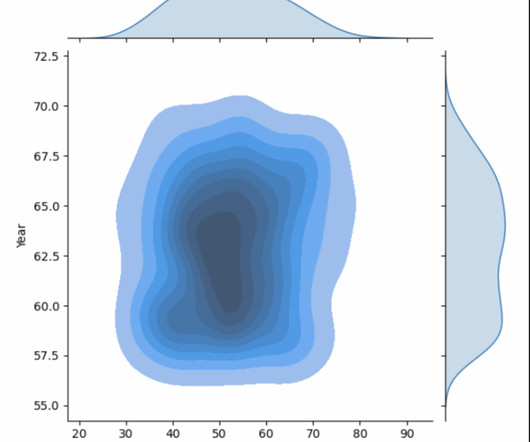
Introduction Exploratory DataAnalysis (EDA) is a process of describing the data by means of statistical and visualization techniques in order to bring important aspects of that data into focus for further analysis. appeared first on Analytics Vidhya.
What are essential commands for dataanalysis in SQL? This article will answer this question by mentioning 10 SQL commands. As a bonus, well add some other SQL commands that are not that common but will certainly add flexibility to your analyses.
What is Exploratory DataAnalysis? […] The post From Data to Insights: A Beginner’s Journey in Exploratory DataAnalysis appeared first on MachineLearningMastery.com. In this article, we’ll walk you through the basics of EDA with simple steps and examples to make it easy to follow.
Data-driven storytelling could be used to influence user actions, and ensure they understand what data matters the most. A good data story is formed by three components: Dataanalysis - This is the basis of a strong story and mastering the data is an essential part of the process.
Improving your business is a daily and tedious task, but using competition data can provide interesting underlying insights. Dataanalysis lets you know how you stack against the competition and how to improve your assets, such as a website, opening hours, extra equipment, etc. This member-only story is on us.
Improving your business is a daily and tedious task, but using competition data can provide interesting underlying insights. Dataanalysis lets you know how you stack against the competition and how to improve your assets, such as a website, opening hours, extra equipment, etc. This member-only story is on us.
Discretization is a fundamental preprocessing technique in dataanalysis and machine learning, bridging the gap between continuous data and methods designed for discrete inputs.
This article introduces six top-notch, free data science resources ideal for aspiring data analysts, data scientists, or anyone aiming to enhance their analytical skills.
Data summarization is an essential first step in any dataanalysis workflow. While Pandas’ describe() function has been a go-to tool for many, its functionality is limited to numeric data and provides only basic statistics.
Handling missing data is one of the most common challenges in dataanalysis and machine learning. Missing values can arise for various reasons, such as errors in data collection, manual omissions, or even the natural absence of information.
Are you curious about what it takes to become a professional data scientist? By following these guides, you can transform yourself into a skilled data scientist and unlock endless career opportunities. Look no further!
In this contributed article, April Miller, a senior IT and cybersecurity writer for ReHack Magazine, discusses how AI can help limit human error and improve dataanalysis accuracy. Explore how AI is fixing human error in data analytics and revolutionizing how we approach this critical field.
Whether you’re involved in an experiment, simulations, dataanalysis or using machine learning, calculating square roots in Python is crucial. In this guide, you […] The post Python Square Root appeared first on Analytics Vidhya.
AI-Driven Math Tools: MGSM can be used to develop AI tools that assist analysts in performing calculations and analyzing financial data, automating routine tasks, such as calculating interest rates or evaluating investment portfolios.
Developed by the Technology Innovation Institute (TII), its built to meet the growing demands of AI-driven applications, whether its generating creative content or dataanalysis. Falcon 3 is the newest breakthrough in the Falcon series of large language models, celebrated for its cutting-edge design and open accessibility.
Discover the full potential of the Julia programming language for dataanalysis and modeling with a comprehensive guide that covers everything from its syntax to advanced techniques.
A large number of high-level decisions and subsequent actions are based on the dataanalysis modern economies cannot exist without. Regardless of whether you are yet to get your first Data Analyst Interview Questions or you are keen on revising your skills in the job market, the process of learning can be rather challenging.
Learn SQL, Python, statistics, mathematics, and dataanalysis—everything you need to learn before you start the journey of becoming a professional data scientist.
Introduction While Tableau remains a popular choice for data visualization, its dominance is waning. The increasing importance of dataanalysis across industries has fueled the demand for versatile tools, leading to a surge in Tableau alternatives.
Introduction Nominal data is one of the most fundamental types of data in dataanalysis. This article examines nominal data’s characteristics, applications, and differences from other data types. Overview What is Nominal Data?
They can be applied to dataanalysis, customer service, content creation, and other areas. Introduction LLMs are changing how we engage with technology today. These AI programs are able to comprehend and mimic human language. But for newcomers in particular, knowing how to use them could appear challenging.
Learn about the most common questions asked during data science interviews. This blog covers non-technical, Python, SQL, statistics, dataanalysis, and machine learning questions.
This means that you can use natural language prompts to perform advanced dataanalysis tasks, generate visualizations, and train machine learning models without the need for complex coding knowledge. With Code Interpreter, you can perform tasks such as dataanalysis, visualization, coding, math, and more.
AI have ability to reason, and generate functioning code in languages like Python, SQL, and R, they can provide impressive value with Dataanalysis. But can they replace data analysts?
Introduction Spreadsheets are essential tools for dataanalysis, but complex formulas can hold you back. That’s where Claude for Sheets, a revolutionary AI add-on from Anthropic, comes in. Ask questions directly in your spreadsheet and get insightful answers using natural language.
Sklearn is a powerful tool for dataanalysis and machine learning, offering a wide range of modules that simplify […] The post Quiz of the Day (Scikit-learn) # 14 appeared first on Analytics Vidhya.
Missing data can cause problems in dataanalysis, so it's important to handle it correctly. In this article, we will explore how to find and remove missing values in R.
Introduction Microsoft Excel and Google Sheets are two of the most basic and commonly used tools for dataanalysis. They offer various built-in functions that help in making statistical computations in every industry. One such function is the CONFIDENCE function. This formula calculates the confidence intervals for a sample dataset.
We all know that some models excel at content generation, others at image creation, while some are masters of dataanalysis. ChatGPT Plus, Gemini Advanced, Claude Pro, or maybe something else? And to get the best of all worlds, youve probably been juggling multiple subscriptions.
ipynb files) are widely used for dataanalysis, scientific computing, and interactive coding. While these notebooks are great for development and sharing code with other data scientists, there are times when you need to convert them to a more universally readable format like PDF. Introduction Jupyter Notebooks (.ipynb
Introduction In the realm of dataanalysis and manipulation, Excel remains a powerhouse tool. Among its many features, the TRANSPOSE function stands out for its ability to reorganize data quickly and efficiently.
Its significance lies in its ability to transform complex data into easily understandable visualizations, aiding in better decision-making processes. At its core, Tableau transcends the boundaries of traditional dataanalysis by providing an intuitive platform where users can seamlessly connect to […] The post What is Tableau?
This posts talks about what needs to be taken care of in IoV dataanalysis, and shows the difference between a near real-time analytic platform and an actual real-time analytic platform with a real-world example.
Automate DataAnalysis with Pandas This member-only story is on us. Created with Abidin Dino AI, to reach it, consider being Paid subscriber to LearnAIWithMe, here Pandas is undoubtedly the most powerful data science library, but what if I told you that you could automate dataanalysis and complete your work with just a click?
A massive community with libraries for machine learning, sleek app development, dataanalysis, cybersecurity, and more. This article is […] The post Top 40 Python Libraries for AI, ML and Data Science appeared first on Analytics Vidhya. Known for its beginner-friendliness, you can dive into AI without complex code.
Window Functions are a powerful tool for analyzing data and can help you gain insights you may not have seen otherwise. By understanding how to use Window Functions in Spark; you can take your dataanalysis skills to the next level […] The post Working with Window Functions in PySpark appeared first on Analytics Vidhya.
We organize all of the trending information in your field so you don't have to. Join 17,000+ users and stay up to date on the latest articles your peers are reading.
You know about us, now we want to get to know you!
Let's personalize your content
Let's get even more personalized
We recognize your account from another site in our network, please click 'Send Email' below to continue with verifying your account and setting a password.


Let's personalize your content