This site uses cookies to improve your experience. To help us insure we adhere to various privacy regulations, please select your country/region of residence. If you do not select a country, we will assume you are from the United States. Select your Cookie Settings or view our Privacy Policy and Terms of Use.
Cookie Settings
Cookies and similar technologies are used on this website for proper function of the website, for tracking performance analytics and for marketing purposes. We and some of our third-party providers may use cookie data for various purposes. Please review the cookie settings below and choose your preference.
Used for the proper function of the website
Used for monitoring website traffic and interactions
Cookie Settings
Cookies and similar technologies are used on this website for proper function of the website, for tracking performance analytics and for marketing purposes. We and some of our third-party providers may use cookie data for various purposes. Please review the cookie settings below and choose your preference.
Strictly Necessary: Used for the proper function of the website
Performance/Analytics: Used for monitoring website traffic and interactions
DataAnalysis Expressions (DAX) is a language used in Analysis Services, Power BI, and Power Pivot in Excel. The Basics of DAX for DataAnalysis DAX is a powerful language that can be used to create dynamic and informative reports that can help you make better decisions.
DataAnalysis Expressions (DAX) is a language used in Analysis Services, Power BI, and Power Pivot in Excel. The Basics of DAX for DataAnalysis DAX is a powerful language that can be used to create dynamic and informative reports that can help you make better decisions.
An overview of dataanalysis, the dataanalysis process, its various methods, and implications for modern corporations. Studies show that 73% of corporate executives believe that companies failing to use dataanalysis on big data lack long-term sustainability.
Top 10 Professions in Data Science: Below, we provide a list of the top data science careers along with their corresponding salary ranges: 1. Data Scientist Data scientists are responsible for designing and implementing datamodels, analyzing and interpreting data, and communicating insights to stakeholders.
Introduction Power BI uses a set of functions, operators, and constants called DAX to perform dynamic computations and analysis. One can enhance their Power BI competency by using DAX features that help in datamodeling and reporting. This article examines the top DAX features that any Power BI user should know.
New big data architectures and, above all, data sharing concepts such as Data Mesh are ideal for creating a common database for many data products and applications. The Event Log DataModel for Process Mining Process Mining as an analytical system can very well be imagined as an iceberg.
These are important for efficient data organization, security, and control. Rules are put in place by databases to ensure data integrity and minimize redundancy. Moreover, organized storage of data facilitates dataanalysis, enabling retrieval of useful insights and data patterns.
For instance, Berkeley’s Division of Data Science and Information points out that entry level data science jobs remote in healthcare involves skills in NLP (Natural Language Processing) for patient and genomic dataanalysis, whereas remote data science jobs in finance leans more on skills in risk modeling and quantitative analysis.
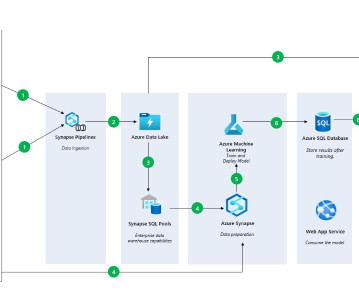
Companies use Business Intelligence (BI), Data Science , and Process Mining to leverage data for better decision-making, improve operational efficiency, and gain a competitive edge. Data Mesh on Azure Cloud with Databricks and Delta Lake for Applications of Business Intelligence, Data Science and Process Mining.
A wide range of applications deals with a variety of tasks, ranging from writing, E-learning, and SEO to medical advice, marketing, dataanalysis, and so much more. The available models are categorized based on the type of tasks they can support, making it easier for users to explore the GPTs of their interest.
The good news is that you don’t need to be an engineer, scientist, or programmer to acquire the necessary dataanalysis skills. Whether you’re located anywhere in the world or belong to any profession, you can still develop the expertise needed to be a skilled data analyst. Who are data analysts?
As more and more companies start to use data-related applications to manage their huge assets of data, the concepts of datamodeling and analytics are becoming increasingly important. Companies use dataanalysis to clean, transform, and model their sets of data, whereas they […].
Summary: This Power BI DAX tutorial introduces beginners to the fundamentals of DataAnalysis Expressions, including syntax, functions, and context. It covers creating measures and calculated columns, using aggregate functions, and applying time intelligence for advanced DataAnalysis. What is DAX?
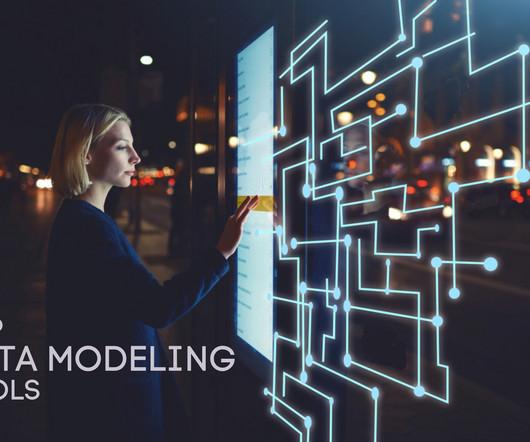
Data is driving most business decisions. In this, datamodeling tools play a crucial role in developing and maintaining the information system. Moreover, it involves the creation of a conceptual representation of data and its relationship. Datamodeling tools play a significant role in this.
Throughout my analytics journey, I’ve encountered all sorts of datamodels, from simple to incredibly complex. I’ve also helped everyone, from data newbies and data experts, implement a wide range of solutions in Sigma Computing. Benefits Enhanced flexibility for modeling and data changes.
It enables organizations to explore, analyze, and visualize data to drive better decision-making. Looker integrates seamlessly with various data sources and provides tools for datamodeling, real-time dashboards, and embedded analytics.
It allows users to connect to a variety of data sources, perform data preparation and transformations, create interactive visualizations, and share insights with others. The platform includes features such as datamodeling, data discovery, dataanalysis, and interactive dashboards.
Data Science is a field that encompasses various disciplines, including statistics, machine learning, and dataanalysis techniques to extract valuable insights and knowledge from data. It is divided into three primary areas: data preparation, datamodeling, and data visualization.
However, to fully harness the potential of a data lake, effective datamodeling methodologies and processes are crucial. Datamodeling plays a pivotal role in defining the structure, relationships, and semantics of data within a data lake. Consistency of data throughout the data lake.
Therefore, if you don’t preprocess the data before applying it in the machine learning or AI algorithms, you are most likely to get wrong, delayed, or no results at all. Hence, data preprocessing is essential and required. Python as a Data Processing Technology. Why Choosing Python Over Other Technologies in FinTech?
Summary: Python simplicity, extensive libraries like Pandas and Scikit-learn, and strong community support make it a powerhouse in DataAnalysis. It excels in data cleaning, visualisation, statistical analysis, and Machine Learning, making it a must-know tool for Data Analysts and scientists. Why Python?
These skills include programming languages such as Python and R, statistics and probability, machine learning, data visualization, and datamodeling. To perform exploratory dataanalysis effectively, data scientists must have a strong understanding of math and statistics.
A wide range of applications deals with a variety of tasks, ranging from writing, E-learning, and SEO to medical advice, marketing, dataanalysis, and so much more. The available models are categorized based on the type of tasks they can support, making it easier for users to explore the GPTs of their interest.
A list of best data science GPTs in the GPT store From the GPT store of OpenAI , below is a list of the 10 most popular data science GPTs for you to explore. Data Analyst Data Analyst is a featured GPT in the store that specializes in dataanalysis and visualization.
It also helps in providing visibility to data and thus enables the users to make informed decisions. Data management software helps in the creation of reports and presentations by automating the process of data collection, data extraction, data cleansing, and dataanalysis.
Using Azure ML to Train a Serengeti DataModel, Fast Option Pricing with DL, and How To Connect a GPU to a Container Using Azure ML to Train a Serengeti DataModel for Animal Identification In this article, we will cover how you can train a model using Notebooks in Azure Machine Learning Studio.
Big Data Analytics News has hailed big data as the future of the translation industry. You might use predictive analysis-based data that can help you analyse buying trends or look at how the business might perform in a range of new markets. Have you ever helped a company expand into a new region using big dataanalysis?
Since the field covers such a vast array of services, data scientists can find a ton of great opportunities in their field. Data scientists use algorithms for creating datamodels. These datamodels predict outcomes of new data. Data science is one of the highest-paid jobs of the 21st century.
Introduction Do you know that, for the past 5 years, ‘Data Scientist’ has consistently ranked among the top 3 job professions in the US market? Having Technical skills and knowledge is one of the best ways to get a hike in your career path. Keeping this in mind, many working professionals and students have started […].
We decided to cover some of the most important differences between Data Mining vs Data Science in order to finally understand which is which. What is Data Science? Data Science is an activity that focuses on dataanalysis and finding the best solutions based on it. It hosts a dataanalysis competition.
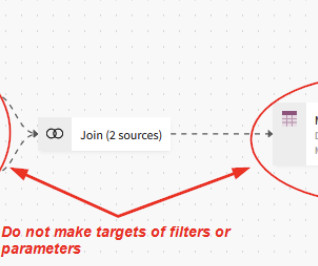
introduces a wide range of capabilities designed to improve every stage of dataanalysis—from data preparation to dashboard consumption. Easily swap root tables in your datamodel. Datamodels can become difficult to manage and understand as you add additional tables. Bronwen Boyd. April 13, 2022.
introduces a wide range of capabilities designed to improve every stage of dataanalysis—from data preparation to dashboard consumption. Easily swap root tables in your datamodel. Datamodels can become difficult to manage and understand as you add additional tables. Bronwen Boyd. April 13, 2022.
By acquiring expertise in statistical techniques, machine learning professionals can develop more advanced and sophisticated algorithms, which can lead to better outcomes in dataanalysis and prediction. Datamodeling involves identifying underlying data structures, identifying patterns, and filling in gaps where data is nonexistent.
The data integration landscape is under a constant metamorphosis. In the current disruptive times, businesses depend heavily on information in real-time and dataanalysis techniques to make better business decisions, raising the bar for data integration. Legacy solutions lack precision and speed while handling big data.
With the introduction and use of machine learning, AI tech is enabling greater efficiencies with respect to data and the insights embedded in the information. Before moving into the hiring process though, it would be helpful to narrow down what type of data your business is managing. Here are the differences, generally speaking.
Empowering Data Scientists Data scientists are leveraging LCNC platforms to prototype and deploy applications for dataanalysis and visualization with remarkable ease. Data scientists must strike a balance between the platform’s simplicity and the customization required for complex datamodels and algorithms.
Why legacy approaches to dataanalysis no longer work. To begin with, we should understand why exactly the legacy data analytics approaches may be considered ineffective. Based on this assumption, specialists relied on false predictive datamodels that could only reflect a simplified picture of the possible future.
Some projects may necessitate a comprehensive LLMOps approach, spanning tasks from data preparation to pipeline production. Exploratory DataAnalysis (EDA) Data collection: The first step in LLMOps is to collect the data that will be used to train the LLM.
With its intuitive interface, Power BI empowers users to connect to various data sources, create interactive reports, and share insights effortlessly. Optimising Power BI reports for performance ensures efficient dataanalysis. What is Power BI, and how does it differ from other data visualisation tools?
Its strength lies in its ability to handle efficient big data processing and perform complex dataanalysis with ease. With features like calculated fields, trend lines, and statistical summaries, Tableau empowers users to conduct in-depth analysis and derive actionable insights from their data.
This will then give you a good grounding in a variety of business topics that you can apply to your own business, allowing you to see patterns and understand the data that you collect. Download the Right DataAnalysis Software.
Within SQL you can also filter data, aggregate it and create valuations, manipulate data, update it, and even do datamodeling. You can perform dataanalysis within SQL Though mentioned in the first example, let’s expand on this a bit more. Let’s briefly dive into each bit.
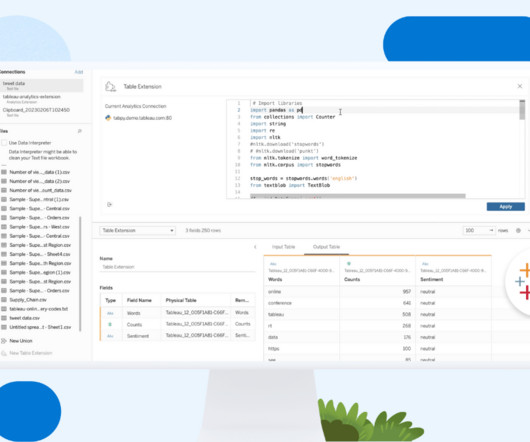
To do this, head to the Analysis tab and select Manage Analytics Extensions Connections. Once the connection is established, head to the data source tab, select New Table Extension and drag and drop it into your datamodel. Table Extensions is a versatile option you can use for analyzing and extracting insights.
We organize all of the trending information in your field so you don't have to. Join 17,000+ users and stay up to date on the latest articles your peers are reading.
You know about us, now we want to get to know you!
Let's personalize your content
Let's get even more personalized
We recognize your account from another site in our network, please click 'Send Email' below to continue with verifying your account and setting a password.


Let's personalize your content