This site uses cookies to improve your experience. To help us insure we adhere to various privacy regulations, please select your country/region of residence. If you do not select a country, we will assume you are from the United States. Select your Cookie Settings or view our Privacy Policy and Terms of Use.
Cookie Settings
Cookies and similar technologies are used on this website for proper function of the website, for tracking performance analytics and for marketing purposes. We and some of our third-party providers may use cookie data for various purposes. Please review the cookie settings below and choose your preference.
Used for the proper function of the website
Used for monitoring website traffic and interactions
Cookie Settings
Cookies and similar technologies are used on this website for proper function of the website, for tracking performance analytics and for marketing purposes. We and some of our third-party providers may use cookie data for various purposes. Please review the cookie settings below and choose your preference.
Strictly Necessary: Used for the proper function of the website
Performance/Analytics: Used for monitoring website traffic and interactions
Introduction PowerBI uses a set of functions, operators, and constants called DAX to perform dynamic computations and analysis. One can enhance their PowerBI competency by using DAX features that help in datamodeling and reporting.
Data is an essential component of any business, and it is the role of a data analyst to make sense of it all. PowerBI is a powerfuldata visualization tool that helps them turn raw data into meaningful insights and actionable decisions. How does a data analyst use PowerBI?
Summary: This PowerBI DAX tutorial introduces beginners to the fundamentals of DataAnalysis Expressions, including syntax, functions, and context. It covers creating measures and calculated columns, using aggregate functions, and applying time intelligence for advanced DataAnalysis. What is DAX?
DataAnalysis Expressions (DAX) is a language used in Analysis Services, PowerBI, and Power Pivot in Excel. The Basics of DAX for DataAnalysis DAX is a powerful language that can be used to create dynamic and informative reports that can help you make better decisions.
DataAnalysis Expressions (DAX) is a language used in Analysis Services, PowerBI, and Power Pivot in Excel. The Basics of DAX for DataAnalysis DAX is a powerful language that can be used to create dynamic and informative reports that can help you make better decisions.
For instance, Berkeley’s Division of Data Science and Information points out that entry level data science jobs remote in healthcare involves skills in NLP (Natural Language Processing) for patient and genomic dataanalysis, whereas remote data science jobs in finance leans more on skills in risk modeling and quantitative analysis.
Companies use Business Intelligence (BI), Data Science , and Process Mining to leverage data for better decision-making, improve operational efficiency, and gain a competitive edge. Data Mesh on Azure Cloud with Databricks and Delta Lake for Applications of Business Intelligence, Data Science and Process Mining.
A wide range of applications deals with a variety of tasks, ranging from writing, E-learning, and SEO to medical advice, marketing, dataanalysis, and so much more. The available models are categorized based on the type of tasks they can support, making it easier for users to explore the GPTs of their interest.
Summary: PowerBI is a leading data analytics platform offering advanced features like real-time analytics and collaborative capabilities. Understanding its significance is vital for aspiring PowerBI developers. Mastering PowerBI can significantly enhance career prospects, given its prevalence in the industry.
Summary: This blog dives into the most promising PowerBI projects, exploring advanced data visualization, AI integration, IoT & blockchain analytics, and emerging technologies. Discover best practices for successful implementation and propel your organization towards data-driven success.
Summary: PowerBI is a business analytics tool transforming data into actionable insights. Key features include AI-powered analytics, extensive data connectivity, customisation options, and robust datamodelling. Customisable dashboards and reports enhance data presentation. Why PowerBI?
New big data architectures and, above all, data sharing concepts such as Data Mesh are ideal for creating a common database for many data products and applications. The Event Log DataModel for Process Mining Process Mining as an analytical system can very well be imagined as an iceberg.
The Datamarts capability opens endless possibilities for organizations to achieve their data analytics goals on the PowerBI platform. Before we look into the PowerBI Datamarts, let us take a step back and understand the meaning of a Datamart. in an enterprise data warehouse. What is PowerBI Datamarts?
Summary: PowerBI alternatives like Tableau, Qlik Sense, and Zoho Analytics provide businesses with tailored DataAnalysis and Visualisation solutions. Selecting the right alternative ensures efficient data-driven decision-making and aligns with your organisation’s goals and budget. What is PowerBI?
Summary: Counting rows is a fundamental task in PowerBI that requires careful consideration. This blog explores how to get total number of rows in power query. Understanding PowerBI and Its Importance PowerBI is a suite of business analytics tools that allows users to analyze data and share insights.
PowerBI Heatmap: Heatmap in PowerBI refers to the type of custom visualisation that businesses analysts utilise for showcasing the relationship between two variables on a map in different colour patches. It offers a wide range of features that make it a popular choice for data professionals, analysts, and organizations.
PowerBI is a versatile and scalable platform that combines self-service and enterprise business intelligence (BI) capabilities. It serves as a comprehensive solution for connecting to diverse data sources and creating compelling visualizations. What is the SWITCH Function?
A wide range of applications deals with a variety of tasks, ranging from writing, E-learning, and SEO to medical advice, marketing, dataanalysis, and so much more. The available models are categorized based on the type of tasks they can support, making it easier for users to explore the GPTs of their interest.
A list of best data science GPTs in the GPT store From the GPT store of OpenAI , below is a list of the 10 most popular data science GPTs for you to explore. Data Analyst Data Analyst is a featured GPT in the store that specializes in dataanalysis and visualization.
Tableau is particularly strong in industries like finance, healthcare, and retail where data-driven decisions are crucial. Use Cases Best suited for organisations already using Microsoft products, PowerBI is excellent for generating reports and dashboards that require real-time dataanalysis.
QGIS, Microsoft's PowerBI, Tableau, and Jupyter notebooks also facilitated many interesting visualizations, particularly for solvers with less programming experience. Many participants used beginner-friendly online interfaces, like NASA Worldview and Giovanni , to explore and manipulate data.
There is a plethora of BI tools available in the market today, with new ones being added yearly. Through a comparative analysis of some of the leading BI tools: Google Looker, Microsoft PowerBI, Tableau and Qlik Sense, discover which BI solution best fits your organization’s data analytics needs to empower informed decision-making.
And that is why: with BI you rely on a broader range of data, get deeper insights into the market, have a better vision of your companies strengths and weaknesses, receive trustworthy forecasts on business trends and get data-backed actionable tips on developing your business. SAP Lumira.
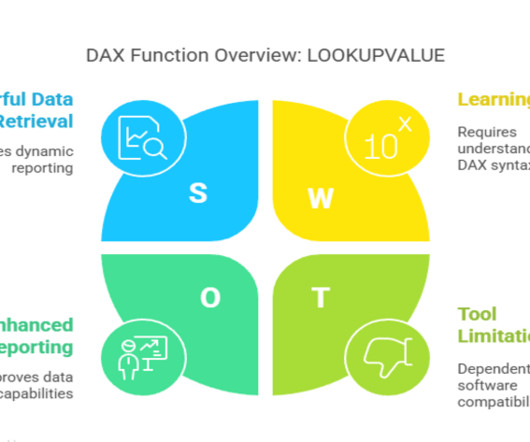
It helps retrieve values from tables based on specific conditions, making it a powerful tool for dataanalysis in PowerBI and Excel. By the end, you’ll have a solid grasp of how and when to leverage dax lookupvalue in your PowerBI reports or Excel Power Pivot models.
Within SQL you can also filter data, aggregate it and create valuations, manipulate data, update it, and even do datamodeling. You can perform dataanalysis within SQL Though mentioned in the first example, let’s expand on this a bit more. Think of Tableau, PowerBI, and QlikView.
Here’s a glimpse into their typical activities Data Acquisition and Cleansing Collecting data from diverse sources, including databases, spreadsheets, and cloud platforms. Ensuring data accuracy and consistency through cleansing and validation processes. Developing datamodels to support analysis and reporting.
BI involves using data mining, reporting, and querying techniques to identify key business metrics and KPIs that can help companies make informed decisions. A career path in BI can be a lucrative and rewarding choice for those with interest in dataanalysis and problem-solving. How to become a blockchain maestro?
BI involves using data mining, reporting, and querying techniques to identify key business metrics and KPIs that can help companies make informed decisions. A career path in BI can be a lucrative and rewarding choice for those with interest in dataanalysis and problem-solving. How to become a blockchain maestro?
Summary: Operations Analyst job in 2025 are integral to improving efficiency, dataanalysis, and process optimisation. With career growth opportunities and a focus on data-driven decisions, this job remains central to organisational success. Expertise in tools like PowerBI, SQL, and Python is crucial.
The primary functions of BI tools include: Data Collection: Gathering data from multiple sources including internal databases, external APIs, and cloud services. Data Processing: Cleaning and organizing data for analysis.
It is the process of converting raw data into relevant and practical knowledge to help evaluate the performance of businesses, discover trends, and make well-informed choices. Data gathering, data integration, datamodelling, analysis of information, and data visualization are all part of intelligence for businesses.
DataAnalysis is one of the most crucial tasks for business organisations today. SQL or Structured Query Language has a significant role to play in conducting practical DataAnalysis. Data Analysts need deeper knowledge on SQL to understand relational databases like Oracle, Microsoft SQL and MySQL.
Overview: Data science vs data analytics Think of data science as the overarching umbrella that covers a wide range of tasks performed to find patterns in large datasets, structure data for use, train machine learning models and develop artificial intelligence (AI) applications.
Tableau is an interactive platform that enables users to analyse and visualise data to gain insights. How Professionals Can Use Tableau for Data Science? Tableau is a powerfuldata visualization and business intelligence tool that can be effectively used by professionals in the field of data science.
At the core of Data Science lies the art of transforming raw data into actionable information that can guide strategic decisions. Role of Data Scientists Data Scientists are the architects of dataanalysis. They clean and preprocess the data to remove inconsistencies and ensure its quality.
Improved Data Navigation Hierarchies provide a clear structure for users to navigate through data. Enhanced DataAnalysis By allowing users to drill down into data, hierarchies enable more detailed analysis. They enable intuitive querying and reporting by providing a clear structure for data exploration.
They are useful for big data analytics where flexibility is needed. Choosing the right storage solution depends on the organization’s needs for speed, scalability, and type of analysis. DataModelingDatamodeling involves creating logical structures that define how data elements relate to each other.
Their tasks encompass: Data Collection and Extraction Identify relevant data sources and gather data from various internal and external systems Extract, transform, and load data into a centralized data warehouse or analytics platform Data Cleaning and Preparation Cleanse and standardize data to ensure accuracy, consistency, and completeness.
Transaction DataAnalysis—Case Study #4 by Data with Danny As a huge FinTech enthusiast, I found myself totally drawn to this project. Before we dive right in, you’d totally love to check out the deliverables that came with this project (a PowerPoint presentation and a very insightful PowerBI dashboard).
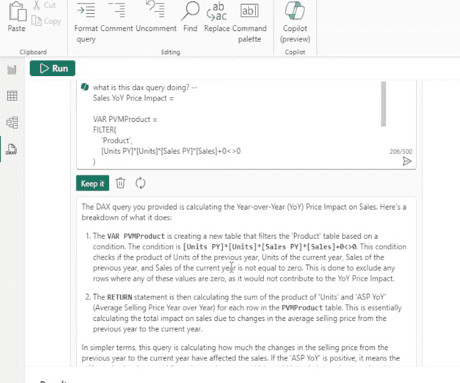
Among the various PowerBI tools available in the digital market to enable data-driven decision-making capabilities, PowerBI has emerged as a market leader. In this blog, we will focus on PowerBI DAX Copilot , a feature exclusively available on PowerBI Desktop.
Amazon Athena Amazon Athena is a serverless query service that enables users to analyse data stored in Amazon S3 using standard SQL. It eliminates the need for complex database management, making dataanalysis more accessible. It helps streamline data processing tasks and ensures reliable execution.
We organize all of the trending information in your field so you don't have to. Join 17,000+ users and stay up to date on the latest articles your peers are reading.
You know about us, now we want to get to know you!
Let's personalize your content
Let's get even more personalized
We recognize your account from another site in our network, please click 'Send Email' below to continue with verifying your account and setting a password.


Let's personalize your content