This site uses cookies to improve your experience. To help us insure we adhere to various privacy regulations, please select your country/region of residence. If you do not select a country, we will assume you are from the United States. Select your Cookie Settings or view our Privacy Policy and Terms of Use.
Cookie Settings
Cookies and similar technologies are used on this website for proper function of the website, for tracking performance analytics and for marketing purposes. We and some of our third-party providers may use cookie data for various purposes. Please review the cookie settings below and choose your preference.
Used for the proper function of the website
Used for monitoring website traffic and interactions
Cookie Settings
Cookies and similar technologies are used on this website for proper function of the website, for tracking performance analytics and for marketing purposes. We and some of our third-party providers may use cookie data for various purposes. Please review the cookie settings below and choose your preference.
Strictly Necessary: Used for the proper function of the website
Performance/Analytics: Used for monitoring website traffic and interactions
For instance, Berkeley’s Division of Data Science and Information points out that entry level data science jobs remote in healthcare involves skills in NLP (Natural Language Processing) for patient and genomic dataanalysis, whereas remote data science jobs in finance leans more on skills in risk modeling and quantitative analysis.
Technical Fellow, Tableau. Innovation is necessary to use data effectively in the pursuit of a better world, particularly because data continues to increase in size and richness. I am proud to announce that my History of Tableau Innovation viz is now published to Tableau Public. Jock Mackinlay. Bronwen Boyd.
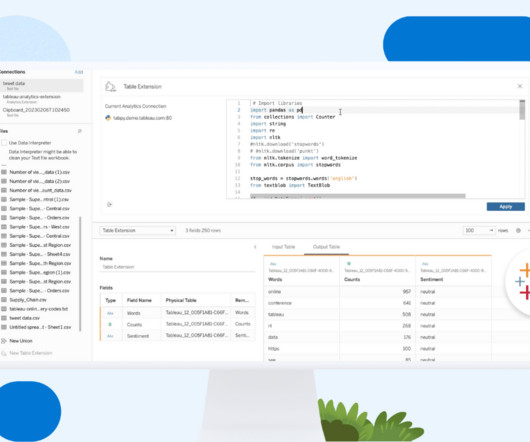
At the root, an Analytics Extension is a server that you stand up to receive data from Tableau in real-time. This data can then be scored, transformed, or augmented to facilitate dynamic exploration. Use Analytics Extensions in Table Calculations Table calculations trigger upon interaction and allow for dynamic what-if analysis.
Companies use Business Intelligence (BI), Data Science , and Process Mining to leverage data for better decision-making, improve operational efficiency, and gain a competitive edge. Data Mesh on Azure Cloud with Databricks and Delta Lake for Applications of Business Intelligence, Data Science and Process Mining.
Product Marketing Associate, Tableau. Tableau 2022.1 introduces a wide range of capabilities designed to improve every stage of dataanalysis—from data preparation to dashboard consumption. This allows you to access the combined wisdom of Tableau’s robust community without ever having to leave the platform.
Product Marketing Associate, Tableau. Tableau 2022.1 introduces a wide range of capabilities designed to improve every stage of dataanalysis—from data preparation to dashboard consumption. This allows you to access the combined wisdom of Tableau’s robust community without ever having to leave the platform.
Technical Fellow, Tableau. Innovation is necessary to use data effectively in the pursuit of a better world, particularly because data continues to increase in size and richness. I am proud to announce that my History of Tableau Innovation viz is now published to Tableau Public. Jock Mackinlay. Bronwen Boyd.
New big data architectures and, above all, data sharing concepts such as Data Mesh are ideal for creating a common database for many data products and applications. The Event Log DataModel for Process Mining Process Mining as an analytical system can very well be imagined as an iceberg.
The good news is that you don’t need to be an engineer, scientist, or programmer to acquire the necessary dataanalysis skills. Whether you’re located anywhere in the world or belong to any profession, you can still develop the expertise needed to be a skilled data analyst. Who are data analysts?
At the root, an Analytics Extension is a server that you stand up to receive data from Tableau in real-time. This data can then be scored, transformed, or augmented to facilitate dynamic exploration. Use Analytics Extensions in Table Calculations Table calculations trigger upon interaction and allow for dynamic what-if analysis.
Tableau is a data visualisation software helping you to generate graphics-rich reporting and analysing enormous volumes of data. With the help of Tableau, organisations have been able to mine and gather actionable insights from granular sources of data. Let’s read the blog to find out!
Summary: Struggling to translate data into clear stories? Tableau can help! This data visualization tool empowers Data Analysts with drag-and-drop simplicity, interactive dashboards, and a wide range of visualizations. What are The Benefits of Learning Tableau for Data Analysts?
Senior Manager, Product Marketing, Tableau. By now, you’ve heard the good news: The business world is embracing data-driven decision making and growing their data practices at an unprecedented clip. At Tableau, we believe that the best decisions are made when everyone is empowered to put data at the center of every conversation.
Even within Tableau, an organization focused on analytics, we have our fair share of governance problems—and they’re not unlike what our customers can experience every day. . With a holistic approach to data governance, you can get to the root of common problems, rather than chasing one-off issues. Datamodeling.
With the right tools, organisations can transform raw data into meaningful insights that drive decision-making. This guide explores some of the most effective tools available for Big Data visualization, highlighting their features, benefits, and ideal use cases.
Through a comparative analysis of some of the leading BI tools: Google Looker, Microsoft Power BI, Tableau and Qlik Sense, discover which BI solution best fits your organization’s data analytics needs to empower informed decision-making. Selecting the right one can seem daunting.
Within SQL you can also filter data, aggregate it and create valuations, manipulate data, update it, and even do datamodeling. You can perform dataanalysis within SQL Though mentioned in the first example, let’s expand on this a bit more. Think of Tableau, Power BI, and QlikView.
Here’s a glimpse into their typical activities Data Acquisition and Cleansing Collecting data from diverse sources, including databases, spreadsheets, and cloud platforms. Ensuring data accuracy and consistency through cleansing and validation processes. Developing datamodels to support analysis and reporting.
Summary: Power BI alternatives like Tableau, Qlik Sense, and Zoho Analytics provide businesses with tailored DataAnalysis and Visualisation solutions. Selecting the right alternative ensures efficient data-driven decision-making and aligns with your organisation’s goals and budget.
BI involves using data mining, reporting, and querying techniques to identify key business metrics and KPIs that can help companies make informed decisions. A career path in BI can be a lucrative and rewarding choice for those with interest in dataanalysis and problem-solving. How to become a blockchain maestro?
BI involves using data mining, reporting, and querying techniques to identify key business metrics and KPIs that can help companies make informed decisions. A career path in BI can be a lucrative and rewarding choice for those with interest in dataanalysis and problem-solving. How to become a blockchain maestro?
Features: design and visualizations interactive dashboards real-time dataanalysis wide capabilities for data extraction and processing integration with a wide range of third-party services (Oracle, Teradata, Excel, Google Cloud). Unique feature: custom visualizations to fit your business needs better. SAP Lumira.
QGIS, Microsoft's Power BI, Tableau, and Jupyter notebooks also facilitated many interesting visualizations, particularly for solvers with less programming experience. Many participants used beginner-friendly online interfaces, like NASA Worldview and Giovanni , to explore and manipulate data.
Architecturally the introduction of Hadoop, a file system designed to store massive amounts of data, radically affected the cost model of data. Organizationally the innovation of self-service analytics, pioneered by Tableau and Qlik, fundamentally transformed the user model for dataanalysis.
It is the process of converting raw data into relevant and practical knowledge to help evaluate the performance of businesses, discover trends, and make well-informed choices. Data gathering, data integration, datamodelling, analysis of information, and data visualization are all part of intelligence for businesses.
DataAnalysis is one of the most crucial tasks for business organisations today. SQL or Structured Query Language has a significant role to play in conducting practical DataAnalysis. Data Analysts need deeper knowledge on SQL to understand relational databases like Oracle, Microsoft SQL and MySQL.
The primary functions of BI tools include: Data Collection: Gathering data from multiple sources including internal databases, external APIs, and cloud services. Data Processing: Cleaning and organizing data for analysis. DataAnalysis : Utilizing statistical methods and algorithms to identify trends and patterns.
Summary: Operations Analyst job in 2025 are integral to improving efficiency, dataanalysis, and process optimisation. With career growth opportunities and a focus on data-driven decisions, this job remains central to organisational success. Their roles now include using advanced technologies like AI and automation.
Overview: Data science vs data analytics Think of data science as the overarching umbrella that covers a wide range of tasks performed to find patterns in large datasets, structure data for use, train machine learning models and develop artificial intelligence (AI) applications.
At the core of Data Science lies the art of transforming raw data into actionable information that can guide strategic decisions. Role of Data Scientists Data Scientists are the architects of dataanalysis. They clean and preprocess the data to remove inconsistencies and ensure its quality.
It eliminates the need for complex database management, making dataanalysis more accessible. Apache Airflow Apache Airflow is a workflow automation tool that allows data engineers to schedule, monitor, and manage data pipelines efficiently. It helps streamline data processing tasks and ensures reliable execution.
In the realm of Data Intelligence, the blog demystifies its significance, components, and distinctions from Data Information, Artificial Intelligence, and DataAnalysis. Key Components of Data Intelligence In Data Intelligence, understanding its core components is like deciphering the secret language of information.
Improved Data Navigation Hierarchies provide a clear structure for users to navigate through data. Enhanced DataAnalysis By allowing users to drill down into data, hierarchies enable more detailed analysis. They enable intuitive querying and reporting by providing a clear structure for data exploration.
They are useful for big data analytics where flexibility is needed. Choosing the right storage solution depends on the organization’s needs for speed, scalability, and type of analysis. DataModelingDatamodeling involves creating logical structures that define how data elements relate to each other.
This article was co-written by Manish Garg & Hakeem Lawrence A common challenge with many business intelligence tools is building trust, often when there isn’t a datamodel and when various BI tools throughout the organization provide conflicting results.
We organize all of the trending information in your field so you don't have to. Join 17,000+ users and stay up to date on the latest articles your peers are reading.
You know about us, now we want to get to know you!
Let's personalize your content
Let's get even more personalized
We recognize your account from another site in our network, please click 'Send Email' below to continue with verifying your account and setting a password.


Let's personalize your content