This site uses cookies to improve your experience. To help us insure we adhere to various privacy regulations, please select your country/region of residence. If you do not select a country, we will assume you are from the United States. Select your Cookie Settings or view our Privacy Policy and Terms of Use.
Cookie Settings
Cookies and similar technologies are used on this website for proper function of the website, for tracking performance analytics and for marketing purposes. We and some of our third-party providers may use cookie data for various purposes. Please review the cookie settings below and choose your preference.
Used for the proper function of the website
Used for monitoring website traffic and interactions
Cookie Settings
Cookies and similar technologies are used on this website for proper function of the website, for tracking performance analytics and for marketing purposes. We and some of our third-party providers may use cookie data for various purposes. Please review the cookie settings below and choose your preference.
Strictly Necessary: Used for the proper function of the website
Performance/Analytics: Used for monitoring website traffic and interactions
Datapreparation is a step within the data project lifecycle where we prepare the raw data for subsequent processes, such as dataanalysis and machine learning modeling.
To address this challenge, businesses need to use advanced dataanalysis methods. These methods can help businesses to make sense of their data and to identify trends and patterns that would otherwise be invisible. In recent years, there has been a growing interest in the use of artificial intelligence (AI) for dataanalysis.
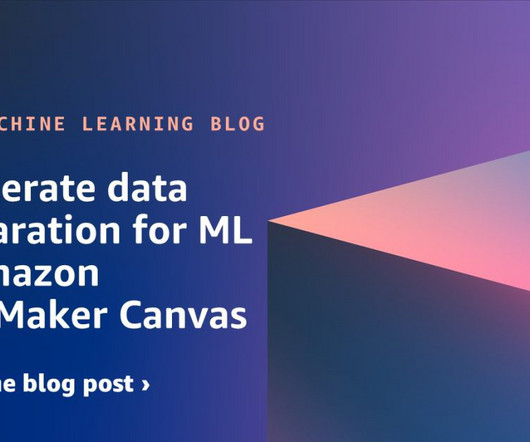
Datapreparation is a crucial step in any machine learning (ML) workflow, yet it often involves tedious and time-consuming tasks. Amazon SageMaker Canvas now supports comprehensive datapreparation capabilities powered by Amazon SageMaker Data Wrangler. Within the data flow, add an Amazon S3 destination node.
Methodology Overview In our work, we follow these steps: Data Generation: Generate a synthetic dataset that contains effects on the behaviour of voters. Exploratory DataAnalysis: Perform exploratory dataanalysis to understand the features’ distributions, relationships, and correlations.
As the topic of companies grappling with datapreparation challenges kicks in, we hear the term ‘augmented analytics’. However, giving it sound-good names does not and will not make a difference unless it is channeled the right way– towards an “actionable” outcome.
Just getting started with Python's Pandas library for dataanalysis? These 7 steps will help you become familiar with its core features so you can begin exploring your data in no time. Or, ready for a quick refresher?
The ML stack is an essential framework for any data scientist or machine learning engineer. With the ability to streamline processes ranging from datapreparation to model deployment and monitoring, it enables teams to efficiently convert raw data into actionable insights.
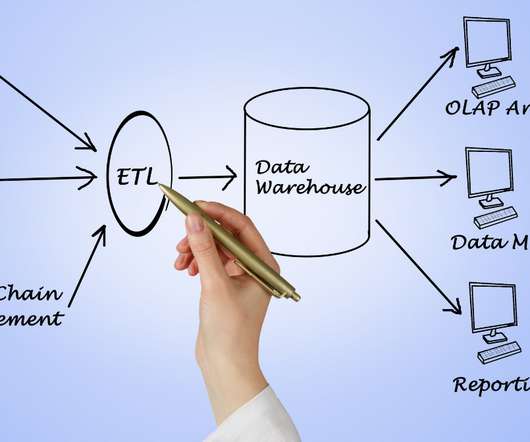
By utilizing algorithms and statistical models, data mining transforms raw data into actionable insights. The data mining process The data mining process is structured into four primary stages: data gathering, datapreparation, data mining, and dataanalysis and interpretation.
This includes sourcing, gathering, arranging, processing, and modeling data, as well as being able to analyze large volumes of structured or unstructured data. The goal of datapreparation is to present data in the best forms for decision-making and problem-solving.
Augmented analytics is revolutionizing how organizations interact with their data. By harnessing the power of machine learning (ML) and natural language processing (NLP), businesses can streamline their dataanalysis processes and make more informed decisions. What is augmented analytics?
It allows users to connect to a variety of data sources, perform datapreparation and transformations, create interactive visualizations, and share insights with others. The platform includes features such as data modeling, data discovery, dataanalysis, and interactive dashboards.
Synthetic data refers to artificially generated data that mirrors the statistical patterns and structures of real datasets without disclosing sensitive information about individuals. Importance of synthetic data The significance of synthetic data lies in its ability to address critical challenges in data handling and analysis.
By analyzing data from IoT devices, organizations can perform maintenance tasks proactively, reducing downtime and operational costs. DatapreparationDatapreparation is a crucial step that includes data cleaning, transforming, and structuring historical data for analysis.
Data Science is a field that encompasses various disciplines, including statistics, machine learning, and dataanalysis techniques to extract valuable insights and knowledge from data. It is divided into three primary areas: datapreparation, data modeling, and data visualization.
Some projects may necessitate a comprehensive LLMOps approach, spanning tasks from datapreparation to pipeline production. Exploratory DataAnalysis (EDA) Data collection: The first step in LLMOps is to collect the data that will be used to train the LLM.
Summary: The Data Science and DataAnalysis life cycles are systematic processes crucial for uncovering insights from raw data. Quality data is foundational for accurate analysis, ensuring businesses stay competitive in the digital landscape. billion INR by 2026, with a CAGR of 27.7%.
Photo by Joshua Sortino on Unsplash Dataanalysis is an essential part of any research or business project. Before conducting any formal statistical analysis, it’s important to conduct exploratory dataanalysis (EDA) to better understand the data and identify any patterns or relationships.
In the sales context, this ensures that sales data remains consistent, accurate, and easily accessible for analysis and reporting. Create Workspace: To work with data in Fabric, first create a workspace with the Fabric trial enabled.
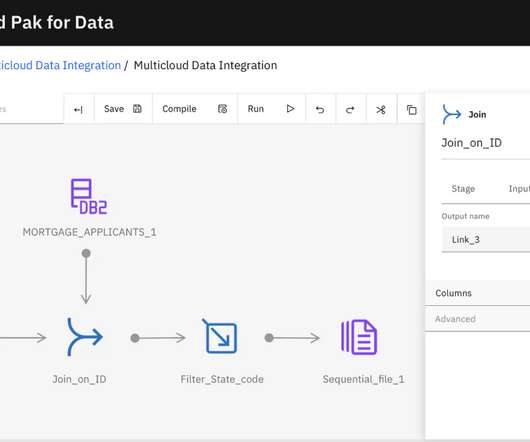
Building on the foundation of data fabric and SQL assets discussed in Enhancing Data Fabric with SQL Assets in IBM Knowledge Catalog , this blog explores how organizations can leverage automated microsegment creation to streamline dataanalysis. For this example, choose MaritalStatus.
With data visualization capabilities, advanced statistical analysis methods and modeling techniques, IBM SPSS Statistics enables users to pursue a comprehensive analytical journey from datapreparation and management to analysis and reporting. How to integrate SPSS Statistics with R and Python?
Generative Visualizations : The AI generates appropriate visualizations based on the user’s query, automatically selecting the best chart types, layouts, and data representations to convey the requested insights. This capability automates much of the manual work traditionally involved in data analytics.
Introduction Data visualization is no longer just a niche skill; it’s a fundamental component of DataAnalysis , business intelligence, and data science. Q1: What is data visualization, and why is it important in DataAnalysis? The approach depends on the context and the amount of missing data.
On August 25 at 11am PDT, Forrester’s VP and Research Director, Gene Leganza, Alation’s Head of Product, Aaron Kalb, and Trifacta’s Director of Product Marketing, Will Davis, will hold a webinar to discuss “Achieving Productivity with Self-Service DataPreparation.” Get the latest data cataloging news and trends in your inbox.
Studies have shown that 80% of time is spent on datapreparation and cleansing, leaving only 20% of time for data analytics. Thus, the earlier in the process that data is cleansed and curated, the more time data consumers can reduce in datapreparation and cleansing.
It makes datapreparation faster. Preparingdata for analysis is time-consuming if you do it manually. Using AI-driven analytics can automate the process by collecting, extracting, and loading the appropriate data for analysis. Of course, challenges with dataanalysis will always be there.
Online analytical processing (OLAP) database systems and artificial intelligence (AI) complement each other and can help enhance dataanalysis and decision-making when used in tandem. Organizations can expect to reap the following benefits from implementing OLAP solutions, including the following.
Studies have shown that 80% of time is spent on datapreparation and cleansing, leaving only 20% of time for data analytics. Thus, the earlier in the process that data is cleansed and curated, the more time data consumers can reduce in datapreparation and cleansing.
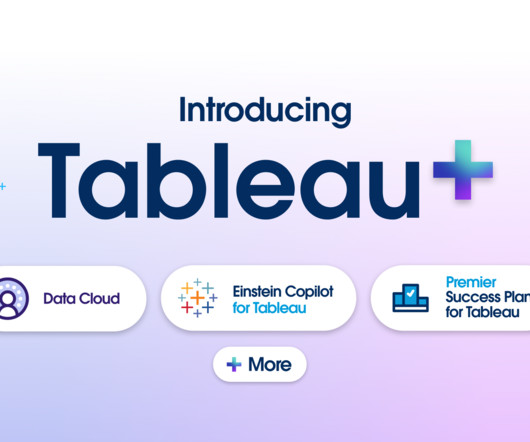
Tableau+ includes: Einstein Copilot for Tableau (only in Tableau+) : Get an intelligent assistant that helps make Tableau easier and analysts more efficient across the platform: In Tableau Prep (coming in 2024.2) : Automate formula creation and speed up datapreparation.
release includes features that speed up and streamline your datapreparation and analysis. Automate dashboard insights with Data Stories. If you've ever written an executive summary of a dashboard, you know it’s time consuming to distill the “so what” of the data. Product Marketing Associate, Tableau.
release includes features that speed up and streamline your datapreparation and analysis. Automate dashboard insights with Data Stories. If you've ever written an executive summary of a dashboard, you know it’s time consuming to distill the “so what” of the data. Product Marketing Associate, Tableau.
Proper data preprocessing is essential as it greatly impacts the model performance and the overall success of dataanalysis tasks ( Image Credit ) Data integration Data integration involves combining data from various sources and formats into a unified and consistent dataset.
As data cataloging has matured and gone mainstream the diversity of data catalogs has expanded, with data catalogs embedded in many datapreparation and dataanalysis tools. The embedded data catalogs offer some advantages of technology integration.
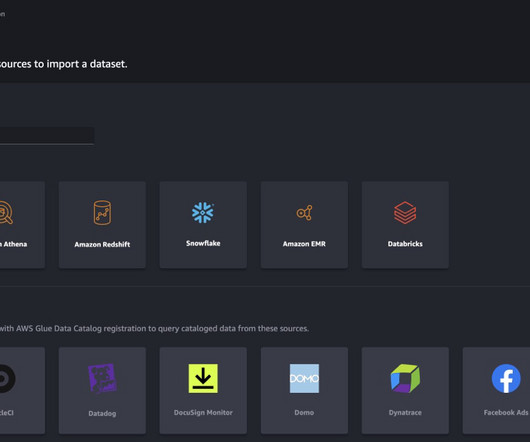
Snowflake is an AWS Partner with multiple AWS accreditations, including AWS competencies in machine learning (ML), retail, and data and analytics. You can import data from multiple data sources, such as Amazon Simple Storage Service (Amazon S3), Amazon Athena , Amazon Redshift , Amazon EMR , and Snowflake.
Exploratory dataanalysis After you import your data, Canvas allows you to explore and analyze it, before building predictive models. You can preview your imported data and visualize the distribution of different features. This information can be used to refine your input data and drive more accurate models.
Users: data scientists vs business professionals People who are not used to working with raw data frequently find it challenging to explore data lakes. To comprehend and transform raw, unstructured data for any specific business use, it typically takes a data scientist and specialized tools.
I am most often prompting this LLM for data visualization code and on-the-fly-visuals because it does all these steps very efficiently. GPT-4 automates the tedious process of datapreparation and visualization, which traditionally requires extensive coding and debugging. This saves me a massive amount of time and effort.
These methods are particularly useful in naturalistic or controlled settings to gather objective data. Analyzing and Interpreting Sampled DataDatapreparation and cleaning Before analysis, sampled data need to undergo cleansing and preparation. How can sampling errors impact dataanalysis results?
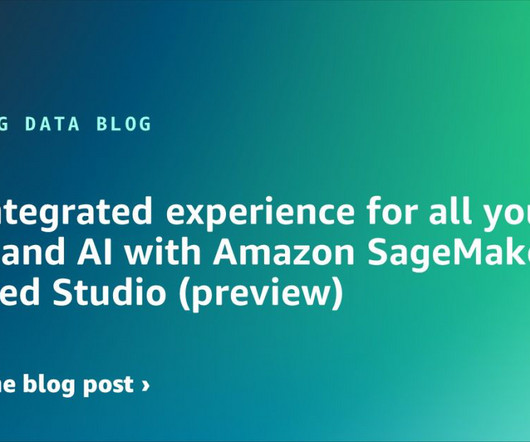
SageMaker Unied Studio is an integrated development environment (IDE) for data, analytics, and AI. Discover your data and put it to work using familiar AWS tools to complete end-to-end development workflows, including dataanalysis, data processing, model training, generative AI app building, and more, in a single governed environment.
Offering features like TensorBoard for data visualization and TensorFlow Extended (TFX) for implementing production-ready ML pipelines, TensorFlow stands out as a comprehensive solution for both beginners and seasoned professionals in the realm of machine learning.
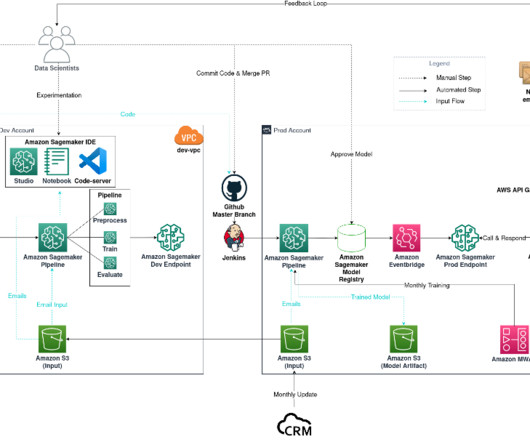
Email classification project diagram The workflow consists of the following components: Model experimentation – Data scientists use Amazon SageMaker Studio to carry out the first steps in the data science lifecycle: exploratory dataanalysis (EDA), data cleaning and preparation, and building prototype models.
There are four main data catalog types that offer different functions based on the needs of your enterprise: Standalone – A standalone data catalog allows for the cataloging of data sets and operations, data set search, evaluation, and requires a high level of interoperability for a seamless user experience.
introduces a wide range of capabilities designed to improve every stage of dataanalysis—from datapreparation to dashboard consumption. In the case of a failed run, backup flows can be set up to ensure that data is refreshed efficiently, without the need to over-schedule flow runs. Bronwen Boyd. April 13, 2022.
introduces a wide range of capabilities designed to improve every stage of dataanalysis—from datapreparation to dashboard consumption. In the case of a failed run, backup flows can be set up to ensure that data is refreshed efficiently, without the need to over-schedule flow runs. Bronwen Boyd. April 13, 2022.
In other words, companies need to move from a model-centric approach to a data-centric approach.” – Andrew Ng A data-centric AI approach involves building AI systems with quality data involving datapreparation and feature engineering. Custom transforms can be written as separate steps within Data Wrangler.
We organize all of the trending information in your field so you don't have to. Join 17,000+ users and stay up to date on the latest articles your peers are reading.
You know about us, now we want to get to know you!
Let's personalize your content
Let's get even more personalized
We recognize your account from another site in our network, please click 'Send Email' below to continue with verifying your account and setting a password.


Let's personalize your content