This site uses cookies to improve your experience. To help us insure we adhere to various privacy regulations, please select your country/region of residence. If you do not select a country, we will assume you are from the United States. Select your Cookie Settings or view our Privacy Policy and Terms of Use.
Cookie Settings
Cookies and similar technologies are used on this website for proper function of the website, for tracking performance analytics and for marketing purposes. We and some of our third-party providers may use cookie data for various purposes. Please review the cookie settings below and choose your preference.
Used for the proper function of the website
Used for monitoring website traffic and interactions
Cookie Settings
Cookies and similar technologies are used on this website for proper function of the website, for tracking performance analytics and for marketing purposes. We and some of our third-party providers may use cookie data for various purposes. Please review the cookie settings below and choose your preference.
Strictly Necessary: Used for the proper function of the website
Performance/Analytics: Used for monitoring website traffic and interactions
Introduction Managing databases often means dealing with duplicate records that can complicate dataanalysis and operations. Whether you’re cleaning up customer lists, transaction logs, or other datasets, removing duplicate rows is vital for maintaining dataquality.
Introduction In the realm of machine learning, the veracity of data holds utmost significance in the triumph of models. Inadequate dataquality can give rise to erroneous predictions, unreliable insights, and overall performance.
Importance of data preprocessing The role of data preprocessing cannot be overstated, as it significantly influences the quality of the dataanalysis process. High-qualitydata is paramount for extracting knowledge and gaining insights.
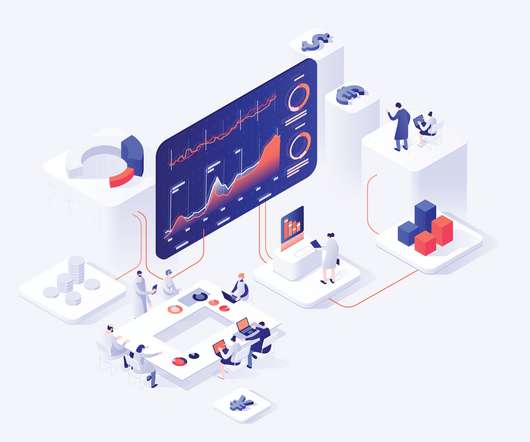
Augmented analytics is revolutionizing how organizations interact with their data. By harnessing the power of machine learning (ML) and natural language processing (NLP), businesses can streamline their dataanalysis processes and make more informed decisions. This leads to better business planning and resource allocation.
Companies use Business Intelligence (BI), Data Science , and Process Mining to leverage data for better decision-making, improve operational efficiency, and gain a competitive edge. It advocates decentralizing data ownership to domain-oriented teams.
Summary: DataAnalysis and interpretation work together to extract insights from raw data. Analysis finds patterns, while interpretation explains their meaning in real life. Overcoming challenges like dataquality and bias improves accuracy, helping businesses and researchers make data-driven choices with confidence.
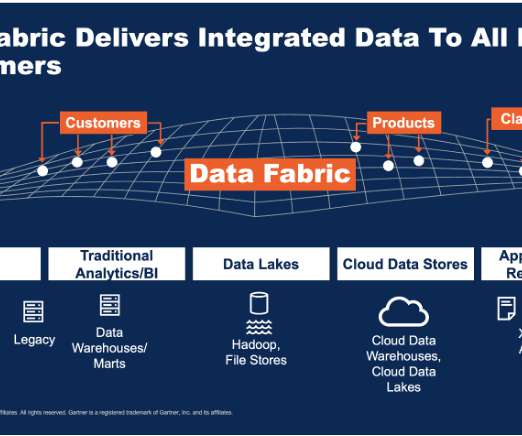
Building on the foundation of data fabric and SQL assets discussed in Enhancing Data Fabric with SQL Assets in IBM Knowledge Catalog , this blog explores how organizations can leverage automated microsegment creation to streamline dataanalysis.
Summary: The Data Science and DataAnalysis life cycles are systematic processes crucial for uncovering insights from raw data. Qualitydata is foundational for accurate analysis, ensuring businesses stay competitive in the digital landscape. Data Cleaning Data cleaning is crucial for data integrity.
Summary: This article explores different types of DataAnalysis, including descriptive, exploratory, inferential, predictive, diagnostic, and prescriptive analysis. Introduction DataAnalysis transforms raw data into valuable insights that drive informed decisions. What is DataAnalysis?
How to Scale Your DataQuality Operations with AI and ML: In the fast-paced digital landscape of today, data has become the cornerstone of success for organizations across the globe. Every day, companies generate and collect vast amounts of data, ranging from customer information to market trends.
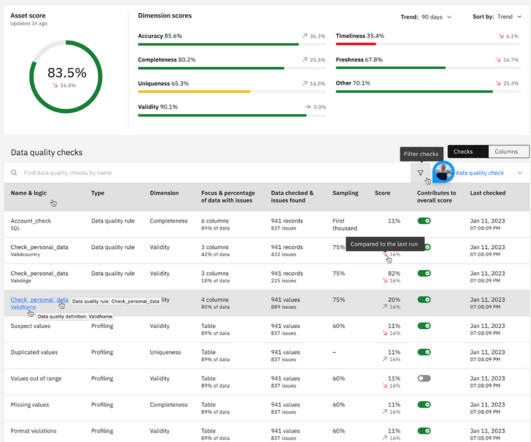
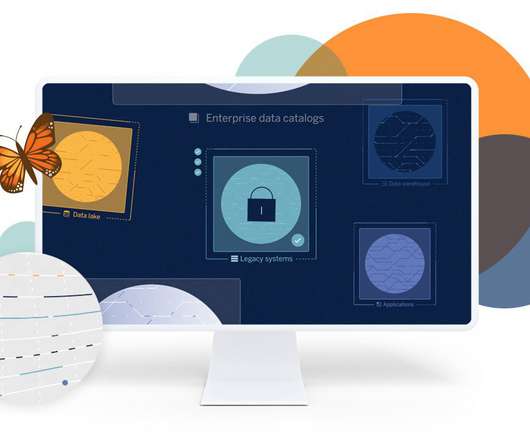
Metadata Enrichment: Empowering Data Governance DataQuality Tab from Metadata Enrichment Metadata enrichment is a crucial aspect of data governance, enabling organizations to enhance the quality and context of their data assets.
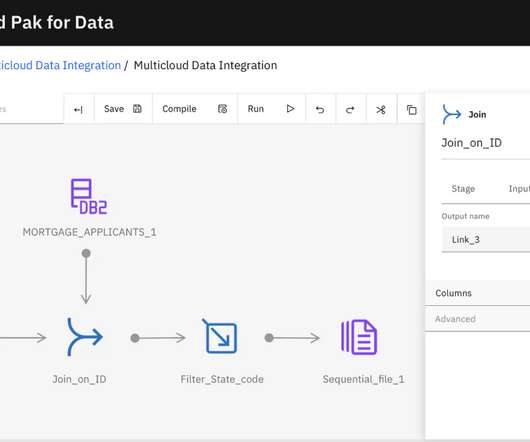
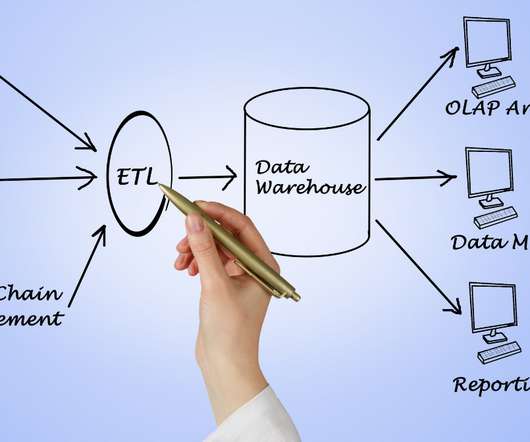
Next Generation DataStage on Cloud Pak for Data Ensuring high-qualitydata A crucial aspect of downstream consumption is dataquality. Studies have shown that 80% of time is spent on data preparation and cleansing, leaving only 20% of time for data analytics. This leaves more time for dataanalysis.
It involves data collection, cleaning, analysis, and interpretation to uncover patterns, trends, and correlations that can drive decision-making. The rise of machine learning applications in healthcare Data scientists, on the other hand, concentrate on dataanalysis and interpretation to extract meaningful insights.
Ensuring high-qualitydata A crucial aspect of downstream consumption is dataquality. Studies have shown that 80% of time is spent on data preparation and cleansing, leaving only 20% of time for data analytics. This leaves more time for dataanalysis. Let’s use address data as an example.
By harmonising and standardising data through ETL, businesses can eliminate inconsistencies and achieve a single version of truth for analysis. Improved DataQualityDataquality is paramount when it comes to making accurate business decisions.
This article is the third in a series taking a deep dive on how to do a current state analysis on your data. This article focuses on data culture, what it is, why it is important, and what questions to ask to determine its current state. The first two articles focused on dataquality and data […].
There are many well-known libraries and platforms for dataanalysis such as Pandas and Tableau, in addition to analytical databases like ClickHouse, MariaDB, Apache Druid, Apache Pinot, Google BigQuery, Amazon RedShift, etc. These tools will help make your initial data exploration process easy.
With the amount of increase in data, the complexity of managing data only keeps increasing. It has been found that data professionals end up spending 75% of their time on tasks other than dataanalysis. Advantages of data fabrication for data management. Dataquality and governance.
To quickly explore the loan data, choose Get data insights and select the loan_status target column and Classification problem type. The generated DataQuality and Insight report provides key statistics, visualizations, and feature importance analyses. Now you have a balanced target column.
Business intelligence projects merge data from various sources for a comprehensive view ( Image credit ) Good business intelligence projects have a lot in common One of the cornerstones of a successful business intelligence (BI) implementation lies in the availability and utilization of cutting-edge BI tools such as Microsoft’s Fabric.
To democratize data, organizations can identify data sources and create a centralized data repository This might involve creating user-friendly data visualization tools, offering training on dataanalysis and visualization, or creating data portals that allow users to easily access and download data.
Big data management increases the reliability of your data. Big data management has many benefits. One of the most important is that it helps to increase the reliability of your data. Dataquality issues can arise from a variety of sources, including: Duplicate records Missing records Incorrect data.
We’ve infused our values into our platform, which supports data fabric designs with a data management layer right inside our platform, helping you break down silos and streamline support for the entire data and analytics life cycle. . Analytics data catalog. Dataquality and lineage. Metadata management.
Introduction Are you struggling to decide between data-driven practices and AI-driven strategies for your business? Besides, there is a balance between the precision of traditional dataanalysis and the innovative potential of explainable artificial intelligence. What are the Three Biggest Challenges of These Approaches?
We’ve infused our values into our platform, which supports data fabric designs with a data management layer right inside our platform, helping you break down silos and streamline support for the entire data and analytics life cycle. . Analytics data catalog. Dataquality and lineage. Metadata management.
Data entry errors will gradually be reduced by these technologies, and operators will be able to fix the problems as soon as they become aware of them. Make Data Profiling Available. To ensure that the data in the network is accurate, data profiling is a typical procedure.
There is no question that big data is very important for many businesses. Unfortunately, big data is only as useful as it is accurate. Dataquality issues can cause serious problems in your big data strategy. It relies on data to drive its AI algorithms. Conversational Utilization to Maintain Audience Data.
Healthcare: The Department of Health — Abu Dhabi plans to use Jais for a range of applications, potentially including dataanalysis and patient interactions. Financial Services: Jais has potential applications in automating customer inquiries, risk assessment, and dataanalysis in the banking and insurance sectors.
Real-World Example: Healthcare systems manage a huge variety of data: structured patient demographics, semi-structured lab reports, and unstructured doctor’s notes, medical images (X-rays, MRIs), and even data from wearable health monitors. Ensuring dataquality and accuracy is a major challenge.
Additionally, unprocessed, raw data is pliable and suitable for machine learning. To find insights, you can analyze your data using a variety of methods, including big data analytics, full text search, real-time analytics, and machine learning. References: Data lake vs data warehouse
Advantages of vector databases Spatial Indexing – Vector databases use spatial indexing techniques like R-trees and Quad-trees to enable data retrieval based on geographical relationships, such as proximity and confinement, which makes vector databases better than other databases.
Better DataQuality With a unified approach to data management, organisations can standardize data formats and governance practices. This leads to improved dataquality, as inconsistencies and errors are minimized.
Unlike supervised learning, where the algorithm is trained on labeled data, unsupervised learning allows algorithms to autonomously identify hidden structures and relationships within data. These algorithms can identify natural clusters or associations within the data, providing valuable insights for demand forecasting.
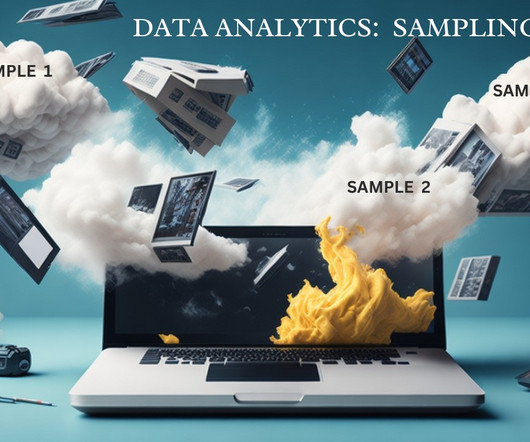
Analyzing and Interpreting Sampled DataData preparation and cleaning Before analysis, sampled data need to undergo cleansing and preparation. This process involves checking for missing values, outliers, and inconsistencies, ensuring dataquality and accuracy.
We also detail the steps that data scientists can take to configure the data flow, analyze the dataquality, and add data transformations. Finally, we show how to export the data flow and train a model using SageMaker Autopilot. Data Wrangler creates the report from the sampled data.
Data Virtualization can include web process automation tools and semantic tools that help easily and reliably extract information from the web, and combine it with corporate information, to produce immediate results. How does Data Virtualization manage dataquality requirements? In forecasting future events.
Sourcing teams are automating processes like dataanalysis as well as supplier relationship management and transaction management. This helps reduce errors to improve dataquality and response times to questions, which improves customer and supplier satisfaction.
Issues such as dataquality, resistance to change, and a lack of skilled personnel can hinder success. Key Takeaways Dataquality is essential for effective Pricing Analytics implementation. Skilled personnel are necessary for accurate DataAnalysis. Clear project scope helps avoid confusion and scope creep.
In the realm of Data Intelligence, the blog demystifies its significance, components, and distinctions from Data Information, Artificial Intelligence, and DataAnalysis. Key Components of Data Intelligence In Data Intelligence, understanding its core components is like deciphering the secret language of information.
The format can be classified by size, but you can choose to organize data horizontally or vertically/by column. It doesn’t matter if you use graphs or charts, you need to get better at data visualization. It might be necessary one day to integrate your data with that of other departments. Metadata makes the task a lot easier.
Here’s a glimpse into their typical activities Data Acquisition and Cleansing Collecting data from diverse sources, including databases, spreadsheets, and cloud platforms. Ensuring data accuracy and consistency through cleansing and validation processes. Developing data models to support analysis and reporting.
Exploratory dataanalysis After you import your data, Canvas allows you to explore and analyze it, before building predictive models. You can preview your imported data and visualize the distribution of different features. This information can be used to refine your input data and drive more accurate models.
Moreover, ignoring the problem statement may lead to wastage of time on irrelevant data. Overlooking DataQuality The quality of the data you are working on also plays a significant role. Dataquality is critical for successful dataanalysis.
We organize all of the trending information in your field so you don't have to. Join 17,000+ users and stay up to date on the latest articles your peers are reading.
You know about us, now we want to get to know you!
Let's personalize your content
Let's get even more personalized
We recognize your account from another site in our network, please click 'Send Email' below to continue with verifying your account and setting a password.


Let's personalize your content