This site uses cookies to improve your experience. To help us insure we adhere to various privacy regulations, please select your country/region of residence. If you do not select a country, we will assume you are from the United States. Select your Cookie Settings or view our Privacy Policy and Terms of Use.
Cookie Settings
Cookies and similar technologies are used on this website for proper function of the website, for tracking performance analytics and for marketing purposes. We and some of our third-party providers may use cookie data for various purposes. Please review the cookie settings below and choose your preference.
Used for the proper function of the website
Used for monitoring website traffic and interactions
Cookie Settings
Cookies and similar technologies are used on this website for proper function of the website, for tracking performance analytics and for marketing purposes. We and some of our third-party providers may use cookie data for various purposes. Please review the cookie settings below and choose your preference.
Strictly Necessary: Used for the proper function of the website
Performance/Analytics: Used for monitoring website traffic and interactions
Get ahead in dataanalysis with our summary of the top 7 must-know statistical techniques. Top statistical techniques – DataScience Dojo Counterfactual causal inference: Counterfactual causal inference is a statistical technique that is used to evaluate the causal significance of historical events.
Python is a powerful and versatile programming language that has become increasingly popular in the field of datascience. One of the main reasons for its popularity is the vast array of libraries and packages available for data manipulation, analysis, and visualization.
In contemporary times, datascience has emerged as a substantial and progressively expanding domain that has an impact on virtually every sphere of human ingenuity: be it commerce, technology, healthcare, education, governance, and beyond. This piece will concentrate on the elemental constituents constituting datascience.
Python is a powerful and versatile programming language that has become increasingly popular in the field of datascience. One of the main reasons for its popularity is the vast array of libraries and packages available for data manipulation, analysis, and visualization.
Image Credit: Pinterest – Problem solving tools In last week’s post , DS-Dojo introduced our readers to this blog-series’ three focus areas, namely: 1) software development, 2) project-management, and 3) datascience. This week, we continue that metaphorical (learning) journey with a fun fact. Better yet, a riddle. IoT, Web 3.0,
While datascience and machine learning are related, they are very different fields. In a nutshell, datascience brings structure to big data while machine learning focuses on learning from the data itself. What is datascience? What is machine learning?
The field of datascience changes constantly, and some frameworks, tools, and algorithms just can’t get the job done anymore. Machine Learning for Beginners Learn the essentials of machine learning including how SupportVectorMachines, Naive Bayesian Classifiers, and Upper Confidence Bound algorithms work.
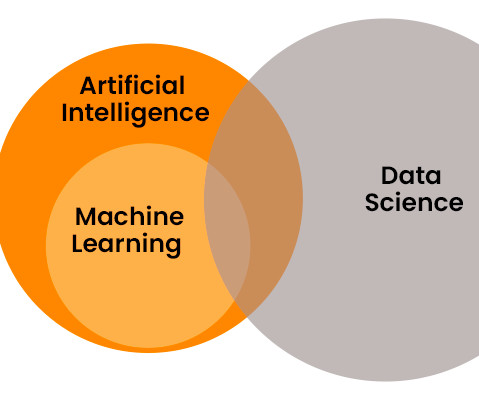
Summary: In the tech landscape of 2024, the distinctions between DataScience and Machine Learning are pivotal. DataScience extracts insights, while Machine Learning focuses on self-learning algorithms. The collective strength of both forms the groundwork for AI and DataScience, propelling innovation.
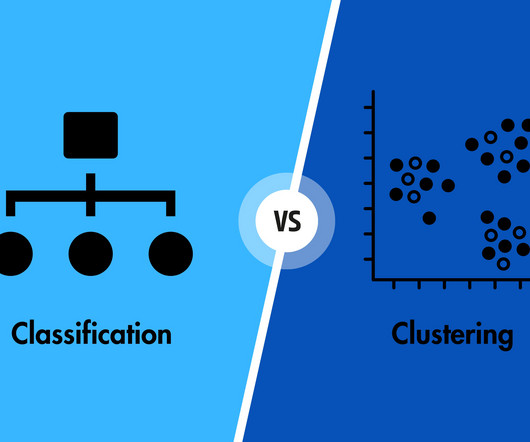
Common Classification Algorithms: Logistic Regression: A popular choice for binary classification, it uses a mathematical function to model the probability of a data point belonging to a particular class. Decision Trees: These work by asking a series of yes/no questions based on data features to classify data points.
Summary: The blog explores the synergy between Artificial Intelligence (AI) and DataScience, highlighting their complementary roles in DataAnalysis and intelligent decision-making. This article explores how AI and DataScience complement each other, highlighting their combined impact and potential.
DataScience interviews are pivotal moments in the career trajectory of any aspiring data scientist. Having the knowledge about the datascience interview questions will help you crack the interview. DataScience skills that will help you excel professionally.
Summary : This article equips Data Analysts with a solid foundation of key DataScience terms, from A to Z. Introduction In the rapidly evolving field of DataScience, understanding key terminology is crucial for Data Analysts to communicate effectively, collaborate effectively, and drive data-driven projects.
The surge of digitization and its growing penetration across the industry spectrum has increased the relevance of text mining in DataScience. Text mining is primarily a technique in the field of DataScience that encompasses the extraction of meaningful insights and information from unstructured textual data.
Hey guys, in this blog we will see some of the most asked DataScience Interview Questions by interviewers in [year]. Datascience has become an integral part of many industries, and as a result, the demand for skilled data scientists is soaring. What is DataScience?
In this era of information overload, utilizing the power of data and technology has become paramount to drive effective decision-making. Decision intelligence is an innovative approach that blends the realms of dataanalysis, artificial intelligence, and human judgment to empower businesses with actionable insights.
Additionally, it allows for quick implementation without the need for complex calculations or dataanalysis, making it a convenient choice for organizations looking for a simple attribution method. Moreover, random forest models as well as supportvectormachines (SVMs) are also frequently applied. link] pone.0278937
What makes it popular is that it is used in a wide variety of fields, including datascience, machine learning, and computational physics. Without this library, dataanalysis wouldn’t be the same without pandas, which reign supreme with its powerful data structures and manipulation tools.
What is machine learning? ML is a computer science, datascience and artificial intelligence (AI) subset that enables systems to learn and improve from data without additional programming interventions. Here, we’ll discuss the five major types and their applications.
Its internal deployment strengthens our leadership in developing dataanalysis, homologation, and vehicle engineering solutions. Classification algorithms like supportvectormachines (SVMs) are especially well-suited to use this implicit geometry of the data.
Anomalies are not inherently bad, but being aware of them, and having data to put them in context, is integral to understanding and protecting your business. The challenge for IT departments working in datascience is making sense of expanding and ever-changing data points.
In a typical MLOps project, similar scheduling is essential to handle new data and track model performance continuously. Load and Explore Data We load the Telco Customer Churn dataset and perform exploratory dataanalysis (EDA). SupportVectorMachine (svm): Versatile model for linear and non-linear data.
Revolutionizing Healthcare through DataScience and Machine Learning Image by Cai Fang on Unsplash Introduction In the digital transformation era, healthcare is experiencing a paradigm shift driven by integrating datascience, machine learning, and information technology.
The field demands a unique combination of computational skills and biological knowledge, making it a perfect match for individuals with a datascience and machine learning background. With continual advancements in algorithms and machine learning tools, the field is poised to make even more significant strides in the future.
Machine Learning is a subset of Artificial Intelligence and Computer Science that makes use of data and algorithms to imitate human learning and improving accuracy. Being an important component of DataScience, the use of statistical methods are crucial in training algorithms in order to make classification.
This data challenge used carbon emission rates sorted by each country to prove or debunk common climate change assumptions with datascience. Understanding trends of the past and simulating future outcomes through available data seeks to lead to better awareness, business intelligence, and policy shaping in years to come.
I will start by looking at the data distribution, followed by the relationship between the target variable and independent variables. Editor's Note: Heartbeat is a contributor-driven online publication and community dedicated to providing premier educational resources for datascience, machine learning, and deep learning practitioners.
That post was dedicated to an exploratory dataanalysis while this post is geared towards building prediction models. Preface In the previous post, we looked at the heart failure dataset of 299 patients, which included several lifestyle and clinical features. among supervised models and k-nearest neighbors, DBSCAN, etc.,
The algorithm works by fitting a hyperplane that encloses the normal data points while excluding the anomalies. In this blog, we covered various statistical and machine learning methods for identifying outliers in your data, and also implemented these methods using Python code.
Summary: Statistical Modeling is essential for DataAnalysis, helping organisations predict outcomes and understand relationships between variables. Introduction Statistical Modeling is crucial for analysing data, identifying patterns, and making informed decisions. Model selection requires balancing simplicity and performance.
One of the best ways to take advantage of social media data is to implement text-mining programs that streamline the process. Machine learning algorithms like Naïve Bayes and supportvectormachines (SVM), and deep learning models like convolutional neural networks (CNN) are frequently used for text classification.
Text categorization is supported by a number of programming languages, including R, Python, and Weka, but the main focus of this article will be text classification with R. R Language Source: i2tutorial R, a popular open-source programming language, is used for statistical computation and dataanalysis.
Decision Trees These trees split data into branches based on feature values, providing clear decision rules. SupportVectorMachines (SVM) SVMs are powerful classifiers that separate data into distinct categories by finding an optimal hyperplane. They are handy for high-dimensional data.
Anomaly detection ( Figure 2 ) is a critical technique in dataanalysis used to identify data points, events, or observations that deviate significantly from the norm. Supervised Learning These methods require labeled data to train the model. The model learns to distinguish between normal and abnormal data points.
We organize all of the trending information in your field so you don't have to. Join 17,000+ users and stay up to date on the latest articles your peers are reading.
You know about us, now we want to get to know you!
Let's personalize your content
Let's get even more personalized
We recognize your account from another site in our network, please click 'Send Email' below to continue with verifying your account and setting a password.


Let's personalize your content