This site uses cookies to improve your experience. To help us insure we adhere to various privacy regulations, please select your country/region of residence. If you do not select a country, we will assume you are from the United States. Select your Cookie Settings or view our Privacy Policy and Terms of Use.
Cookie Settings
Cookies and similar technologies are used on this website for proper function of the website, for tracking performance analytics and for marketing purposes. We and some of our third-party providers may use cookie data for various purposes. Please review the cookie settings below and choose your preference.
Used for the proper function of the website
Used for monitoring website traffic and interactions
Cookie Settings
Cookies and similar technologies are used on this website for proper function of the website, for tracking performance analytics and for marketing purposes. We and some of our third-party providers may use cookie data for various purposes. Please review the cookie settings below and choose your preference.
Strictly Necessary: Used for the proper function of the website
Performance/Analytics: Used for monitoring website traffic and interactions
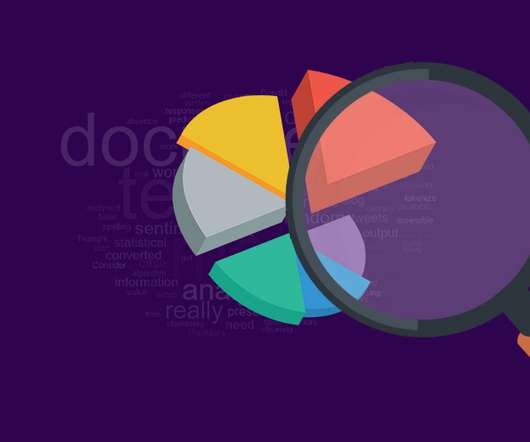
This article was published as a part of the Data Science Blogathon What is EDA(Exploratory dataanalysis)? Exploratory dataanalysis is a great way of understanding and analyzing the data sets. The post Exploratory DataAnalysis on UBER Stocks Dataset appeared first on Analytics Vidhya.
ArticleVideo Book This article was published as a part of the Data Science Blogathon Overview Python Pandas library is becoming most popular between datascientists. The post EDA – Exploratory DataAnalysis Using Python Pandas and SQL appeared first on Analytics Vidhya.
In this blog, we will discuss exploratory dataanalysis, also known as EDA, and why it is important. We will also be sharing code snippets so you can try out different analysis techniques yourself. This can be useful for identifying patterns and trends in the data. So, without any further ado let’s dive right in.
Want to know how to become a Datascientist? Use data to uncover patterns, trends, and insights that can help businesses make better decisions. A datascientist could analyze sales data, customer surveys, and social media trends to determine the reason. It’s like deciphering a secret code.
Introduction Python is a versatile and powerful programming language that plays a central role in the toolkit of datascientists and analysts. Its simplicity and readability make it a preferred choice for working with data, from the most fundamental tasks to cutting-edge artificial intelligence and machine learning.
Introduction In today’s data-driven world, the role of datascientists has become indispensable. in data science to unravel the mysteries hidden within vast data sets? But what if I told you that you don’t need a Ph.D.
For datascientists, this shift has opened up a global market of remote data science jobs, with top employers now prioritizing skills that allow remote professionals to thrive. Here’s everything you need to know to land a remote data science job, from advanced role insights to tips on making yourself an unbeatable candidate.
As data science evolves and grows, the demand for skilled datascientists is also rising. A datascientist’s role is to extract insights and knowledge from data and to use this information to inform decisions and drive business growth.
Datascientists are continuously advancing with AI tools and technologies to enhance their capabilities and drive innovation in 2024. The integration of AI into data science has revolutionized the way data is analyzed, interpreted, and utilized. Have you used voice assistants like Siri or Alexa?
The field of data science and analytics is booming, with exciting career opportunities for those with the right skills and expertise. So, let’s […] The post DataScientist vs Data Analyst: Which is a Better Career Option to Pursue in 2023? appeared first on Analytics Vidhya.
Datavisualization is the art of presenting complex information in a way that is easy to understand and analyze. With the explosion of data in today’s business world, the ability to create compelling datavisualizations has become a critical skill for anyone working with data.
Datascientists use data to uncover patterns, trends, and insights that can help businesses make better decisions. A datascientist could analyze sales data, customer surveys, and social media trends to determine the reason. Handling Uncertainty: Data is often messy and incomplete.
Machine learning engineer vs datascientist: two distinct roles with overlapping expertise, each essential in unlocking the power of data-driven insights. As businesses strive to stay competitive and make data-driven decisions, the roles of machine learning engineers and datascientists have gained prominence.
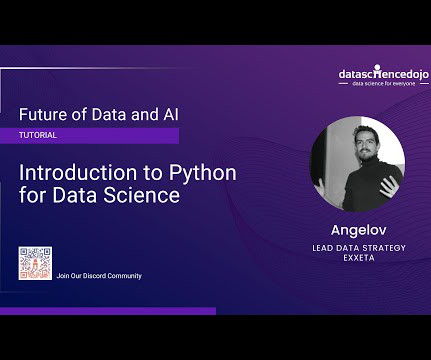
Look no further than Data Science Dojo’s Introduction to Python for Data Science course. This instructor-led live training course is designed for individuals who want to learn how to use Python to perform dataanalysis, visualization, and manipulation.
This means that you can use natural language prompts to perform advanced dataanalysis tasks, generate visualizations, and train machine learning models without the need for complex coding knowledge. Data manipulation: You can use the plugin to perform data cleaning, transformation, and feature engineering tasks.
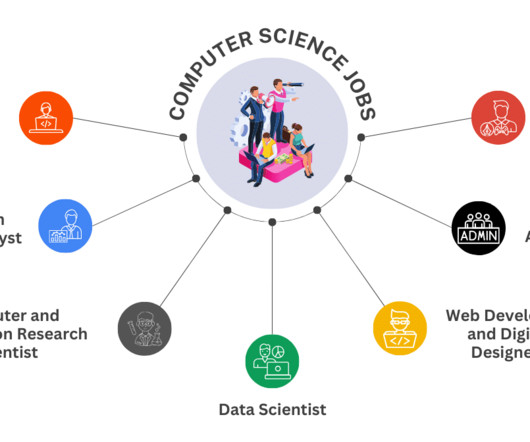
Top 10 Professions in Data Science: Below, we provide a list of the top data science careers along with their corresponding salary ranges: 1. DataScientistDatascientists are responsible for designing and implementing data models, analyzing and interpreting data, and communicating insights to stakeholders.
Today’s question is, “What does a datascientist do.” ” Step into the realm of data science, where numbers dance like fireflies and patterns emerge from the chaos of information. In this blog post, we’re embarking on a thrilling expedition to demystify the enigmatic role of datascientists.
Data types are a defining feature of big data as unstructured data needs to be cleaned and structured before it can be used for data analytics. In fact, the availability of clean data is among the top challenges facing datascientists.
One of the main reasons for its popularity is the vast array of libraries and packages available for data manipulation, analysis, and visualization. It supports large, multi-dimensional arrays and matrices of numerical data, as well as a large library of mathematical functions to operate on these arrays.
DataScientistDatascientists are like detectives for information, sifting through massive amounts of data to uncover patterns and insights using their computer science and statistics knowledge. They employ tools such as algorithms and predictive models to forecast future trends based on present data.
One of the main reasons for its popularity is the vast array of libraries and packages available for data manipulation, analysis, and visualization. It supports large, multi-dimensional arrays and matrices of numerical data, as well as a large library of mathematical functions to operate on these arrays.
Data Science is a field that encompasses various disciplines, including statistics, machine learning, and dataanalysis techniques to extract valuable insights and knowledge from data. It is divided into three primary areas: data preparation, data modeling, and datavisualization.
A wide range of applications deals with a variety of tasks, ranging from writing, E-learning, and SEO to medical advice, marketing, dataanalysis, and so much more. However, our focus lies on exploring the GPTs for data science available on the platform. You can upload your data files to this GPT that it can then analyze.
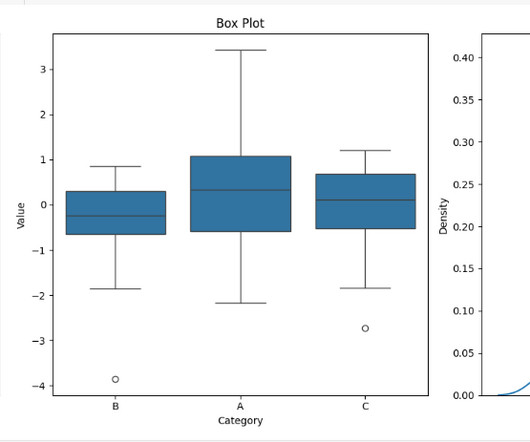
Introduction This article explores violin plots, a powerful visualization tool that combines box plots with density plots. It explains how these plots can reveal patterns in data, making them useful for datascientists and machine learning practitioners.
Also: Activation maps for deep learning models in a few lines of code; The 4 Quadrants of Data Science Skills and 7 Principles for Creating a Viral DataVisualization; OpenAI Tried to Train AI Agents to Play Hide-And-Seek but Instead They Were Shocked by What They Learned; 10 Great Python Resources for Aspiring DataScientists.
Unfortunately, you can’t have a friendly conversation with the data, but don’t worry, we have the next best solution. Datavisualizations: Datavisualization is the art and science of representing complex data in a visual and comprehensible form.
A case study example with UN population projection data The GPT-4 Python Code Interpreter, is turning heads in the world of data science for its ability to instantly generate datavisualization code AND display the results. Join thousands of data leaders on the AI newsletter.
Four Essential Tools Every DataScientist Should Have in Their Toolbox This member-only story is on us. Photo by Adam Śmigielski on Unsplash It’s a great time to be a datascientist! Last Updated on September 8, 2023 by Editorial Team Author(s): Francis Adrian Viernes Originally published on Towards AI.
For budding datascientists and data analysts, there are mountains of information about why you should learn R over Python and the other way around. Though both are great to learn, what gets left out of the conversation is a simple yet powerful programming language that everyone in the data science world can agree on, SQL.
This blog lists down-trending data science, analytics, and engineering GitHub repositories that can help you with learning data science to build your own portfolio. What is GitHub? GitHub is a powerful platform for datascientists, data analysts, data engineers, Python and R developers, and more.
print(llm("Suggest 3 bday gifts for a datascientist"))>>> 1. A subscription to a data science magazine or journal2. A set of data science books3. A data science-themed mug or t-shirt As you can see, we initialize an LLM and call it with a query. turbo", temperature=0.01)conversation_history
Similarly, if a DataScientist. Introduction- One who knows how to improvise and can deal with all kinds of situations is a winner, right? The post An Efficient way of performing EDA- Hypothesis Generation appeared first on Analytics Vidhya.
Geospatial analysis, a powerful technique for understanding spatial patterns and relationships within geographic data, has found a remarkable ally in ChatGPT – the conversational AI model developed by OpenAI. ChatGPT, powered by GPT-3, is a state-of-the-art NLP model capable of processing and generating human-like text.
It helps you visualizedata and seamlessly share the insights from it with stakeholders. Whether you’re a datascientist, an analyst, or a business user, Power BI is a must-know tool that can make your work a lot easier. Introduction Power BI is a freely available tool from Microsoft for business analytics.
Why Your Current Visualizations Arent Telling the Full Story This member-only story is on us. Photo by Firmbee.com on Unsplash When it comes to datavisualization, Plotly is one of my go-to tools. Upgrade to access all of Medium. Its intuitive, interactive, and offers endless possibilities.
In todays fast-paced data-driven world, open-source solutions are transforming industries by providing flexible, scalable, and community-driven innovations. Whether youre a datascientist, engineer, or AI researcher, tapping into open-source technologies can accelerate your work while fostering collaboration.
Why Your Current Visualizations Arent Telling the Full Story This member-only story is on us. Photo by Firmbee.com on Unsplash When it comes to datavisualization, Plotly is one of my go-to tools. Upgrade to access all of Medium. Its intuitive, interactive, and offers endless possibilities.
Why Your Current Visualizations Arent Telling the Full Story This member-only story is on us. Photo by Firmbee.com on Unsplash When it comes to datavisualization, Plotly is one of my go-to tools. Upgrade to access all of Medium. Its intuitive, interactive, and offers endless possibilities.
Why Your Current Visualizations Arent Telling the Full Story This member-only story is on us. Photo by Firmbee.com on Unsplash When it comes to datavisualization, Plotly is one of my go-to tools. Upgrade to access all of Medium. Its intuitive, interactive, and offers endless possibilities.
Why Your Current Visualizations Arent Telling the Full Story This member-only story is on us. Photo by Firmbee.com on Unsplash When it comes to datavisualization, Plotly is one of my go-to tools. Upgrade to access all of Medium. Its intuitive, interactive, and offers endless possibilities.
Why Your Current Visualizations Arent Telling the Full Story This member-only story is on us. Photo by Firmbee.com on Unsplash When it comes to datavisualization, Plotly is one of my go-to tools. Upgrade to access all of Medium. Its intuitive, interactive, and offers endless possibilities.
It could explain how these distributions are used in different machine learning algorithms and why understanding them is crucial for datascientists. 32 datasets to uplift your skills in data science Data Science Dojo has created an archive of 32 data sets for you to use to practice and improve your skills as a datascientist.
A wide range of applications deals with a variety of tasks, ranging from writing, E-learning, and SEO to medical advice, marketing, dataanalysis, and so much more. However, our focus lies on exploring the GPTs for data science available on the platform. You can upload your data files to this GPT that it can then analyze.
Data Analyst Data Analyst is a featured GPT in the store that specializes in dataanalysis and visualization. You can upload your data files to this GPT that it can then analyze. Other than the advanced dataanalysis, it can also deal with image conversions.
We organize all of the trending information in your field so you don't have to. Join 17,000+ users and stay up to date on the latest articles your peers are reading.
You know about us, now we want to get to know you!
Let's personalize your content
Let's get even more personalized
We recognize your account from another site in our network, please click 'Send Email' below to continue with verifying your account and setting a password.


Let's personalize your content