This site uses cookies to improve your experience. To help us insure we adhere to various privacy regulations, please select your country/region of residence. If you do not select a country, we will assume you are from the United States. Select your Cookie Settings or view our Privacy Policy and Terms of Use.
Cookie Settings
Cookies and similar technologies are used on this website for proper function of the website, for tracking performance analytics and for marketing purposes. We and some of our third-party providers may use cookie data for various purposes. Please review the cookie settings below and choose your preference.
Used for the proper function of the website
Used for monitoring website traffic and interactions
Cookie Settings
Cookies and similar technologies are used on this website for proper function of the website, for tracking performance analytics and for marketing purposes. We and some of our third-party providers may use cookie data for various purposes. Please review the cookie settings below and choose your preference.
Strictly Necessary: Used for the proper function of the website
Performance/Analytics: Used for monitoring website traffic and interactions
Introduction PowerBI is a freely available tool from Microsoft for business analytics. It helps you visualize data and seamlessly share the insights from it with stakeholders. Whether you’re a datascientist, an analyst, or a business user, PowerBI is a must-know tool that can make your work a lot easier.
For datascientists, this shift has opened up a global market of remote data science jobs, with top employers now prioritizing skills that allow remote professionals to thrive. Here’s everything you need to know to land a remote data science job, from advanced role insights to tips on making yourself an unbeatable candidate.
In the sales context, this ensures that sales data remains consistent, accurate, and easily accessible for analysis and reporting. In the sales context, this helps monitor sales data in PowerBI reports and trigger alerts or actions based on real-time changes, ensuring that sales teams can respond quickly to critical events.
A wide range of applications deals with a variety of tasks, ranging from writing, E-learning, and SEO to medical advice, marketing, dataanalysis, and so much more. However, our focus lies on exploring the GPTs for data science available on the platform. You can upload your data files to this GPT that it can then analyze.
This blog lists down-trending data science, analytics, and engineering GitHub repositories that can help you with learning data science to build your own portfolio. What is GitHub? GitHub is a powerful platform for datascientists, data analysts, data engineers, Python and R developers, and more.
With the explosion of data in today’s business world, the ability to create compelling data visualizations has become a critical skill for anyone working with data. In this article, we’ll explore the art of data visualization and how it can be used to tell compelling stories with business analytics.
For budding datascientists and data analysts, there are mountains of information about why you should learn R over Python and the other way around. Though both are great to learn, what gets left out of the conversation is a simple yet powerful programming language that everyone in the data science world can agree on, SQL.
Summary : Microsoft Fabric is an end-to-end Data Analytics platform designed for integration, processing, and advanced insights, while PowerBI excels in creating interactive visualisations and reports. Both tools complement each other, enabling seamless data management and visualisation. What is PowerBI?
Open source business intelligence software is a game-changer in the world of dataanalysis and decision-making. It has revolutionized the way businesses approach data analytics by providing cost-effective and customizable solutions that are tailored to specific business needs.
Google Releases a tool for Automated Exploratory DataAnalysis Exploring data is one of the first activities a datascientist performs after getting access to the data. This command-line tool helps to determine the properties and quality of the data as well the predictive power.
print(llm("Suggest 3 bday gifts for a datascientist"))>>> 1. A subscription to a data science magazine or journal2. A set of data science books3. A data science-themed mug or t-shirt As you can see, we initialize an LLM and call it with a query. turbo", temperature=0.01)conversation_history
A wide range of applications deals with a variety of tasks, ranging from writing, E-learning, and SEO to medical advice, marketing, dataanalysis, and so much more. However, our focus lies on exploring the GPTs for data science available on the platform. You can upload your data files to this GPT that it can then analyze.
A list of best data science GPTs in the GPT store From the GPT store of OpenAI , below is a list of the 10 most popular data science GPTs for you to explore. Data Analyst Data Analyst is a featured GPT in the store that specializes in dataanalysis and visualization.
When it comes to data analytics , not much is easier to use than a spreadsheet. For this reason, spreadsheets have been the predominant tool when it comes to basic dataanalysis for the past 20 years. If you work with data, you’ve done work in Excel or Google Sheets. Easy, Powerful, and Flexible. Easy Smeasy.
QGIS, Microsoft's PowerBI, Tableau, and Jupyter notebooks also facilitated many interesting visualizations, particularly for solvers with less programming experience. Many participants used beginner-friendly online interfaces, like NASA Worldview and Giovanni , to explore and manipulate data.
Summary: This blog provides a comprehensive roadmap for aspiring Azure DataScientists, outlining the essential skills, certifications, and steps to build a successful career in Data Science using Microsoft Azure. This roadmap aims to guide aspiring Azure DataScientists through the essential steps to build a successful career.
Accordingly, Data Analysts use various tools for DataAnalysis and Excel is one of the most common. Significantly, the use of Excel in DataAnalysis is beneficial in keeping records of data over time and enabling data visualization effectively. What is DataAnalysis?
A DataScientist’s average salary in India is up to₹ 8.0 Well, one of the key factors drawing attention towards the DataScientist job profile is the higher pay package. In fact, the highest salary of a DataScientist in India can be up to ₹ 26.0 DataScientist Salary in Hyderabad : ₹ 8.0
Data preprocessing ensures the removal of incorrect, incomplete, and inaccurate data from datasets, leading to the creation of accurate and useful datasets for analysis ( Image Credit ) Data completeness One of the primary requirements for data preprocessing is ensuring that the dataset is complete, with minimal missing values.
For instance, a Data Science team analysing terabytes of data can instantly provision additional processing power or storage as required, avoiding bottlenecks and delays. This scalability ensures DataScientists can experiment with large datasets without worrying about infrastructure constraints.
Data Storytelling in Action: This panel will discuss the importance of data visualization in storytelling in different industries, different visualization tools, tips on improving one’s visualization skills, personal experiences, breakthroughs, pressures, and frustrations as well as successes and failures.
For years, spreadsheet programs like Microsoft Excel, Google sheet, and more sophisticated programs like Microsoft PowerBI have been the primary tools for dataanalysis. With anomaly detection, you can easily identify suspicious groups of users, defective products, or abnormalities in the client’s data.
Overview: Data science vs data analytics Think of data science as the overarching umbrella that covers a wide range of tasks performed to find patterns in large datasets, structure data for use, train machine learning models and develop artificial intelligence (AI) applications.
Here’s a list of key skills that are typically covered in a good data science bootcamp: Programming Languages : Python : Widely used for its simplicity and extensive libraries for dataanalysis and machine learning. R : Often used for statistical analysis and data visualization.
Precision in questioning sets the stage for meaningful and impactful dataanalysis. Harness the Power of Visuals Exploit the picture superiority effect by incorporating visuals into your data presentations. PowerBI and Tableau can create interactive dashboards that users can easily play with data.
Some major business intelligence platforms, like Microsoft’s PowerBI and Tableau , have already integrated NLP features — like semantic search. Semantic search functions allow non-subject matter experts to learn from data sets by posing questions in natural language. General-Audience AI Tools.
With the help of Tableau, organisations have been able to mine and gather actionable insights from granular sources of data. Tableau can help DataScientists generate graphs, charts, maps and data-driven stories, etc for purpose of visualisation and analysing data.
Unfolding the difference between data engineer, datascientist, and data analyst. Data engineers are essential professionals responsible for designing, constructing, and maintaining an organization’s data infrastructure. Role of DataScientistsDataScientists are the architects of dataanalysis.
Summary: Dive into programs at Duke University, MIT, and more, covering DataAnalysis, Statistical quality control, and integrating Statistics with Data Science for diverse career paths. offer modules in Statistical modelling, biostatistics, and comprehensive Data Science bootcamps, ensuring practical skills and job placement.
DataAnalysis is the process of collecting, cleaning, transforming, and modeling data to extract useful information and insights. In today’s data-driven world, dataanalysis has become an essential skill for organizations across industries to make informed decisions and improve business outcomes.
DataAnalysis is one of the most crucial tasks for business organisations today. SQL or Structured Query Language has a significant role to play in conducting practical DataAnalysis. Data Analysts need deeper knowledge on SQL to understand relational databases like Oracle, Microsoft SQL and MySQL.
Like Tabeau, its no-code functionality combined with AI-enhanced features can help users bring out most of their data. Microsoft PowerBI Microsoft PowerBI is almost synonymous with comprehensive business intelligence capabilities.
These courses introduce you to Python, Statistics, and Machine Learning , all essential to Data Science. Starting with these basics enables a smoother transition to more specialised topics, such as Data Visualisation, Big DataAnalysis , and Artificial Intelligence. Short, Impactful Format : The 2.5-hour
Here are some reasons highlighting the significance of Data Visualization in Data Science: Data Understanding and Exploration: Data Visualization helps in gaining a deeper understanding of the data by visually representing patterns, trends, and relationships that may not be apparent in raw data.
Big Data Analytics This involves analyzing massive datasets that are too large and complex for traditional dataanalysis methods. Big Data Analytics is used in healthcare to improve operational efficiency, identify fraud, and conduct large-scale population health studies. How is Data Science Used in Medical Research?
Both roles require strong analytical skills, proficiency in SQL and other programming languages, and the ability to interpret data and provide insights. Both roles also require excellent communication skills to convey findings to stakeholders without a DataAnalysis background. Tableau, PowerBI).
Being part of Data Science, the implementation of these technologies requires expert guidance and monitoring. As a result, DataScientists are constantly in demand in the market, many are transitioning their careers in the same field. Various features of the Data Science course with the Job Guarantee Program by Pickl.AI
We looked at over 25,000 job descriptions, and these are the data analytics platforms, tools, and skills that employers are looking for in 2023. Excel is the second most sought-after tool in our chart as you’ll see below as it’s still an industry standard for data management and analytics.
A well-organized portfolio demonstrates your ability to work with data and draw valuable insights. Here are the steps to build an impressive data analyst portfolio: Select Relevant Projects: Choose a variety of dataanalysis projects that highlight your skills and cover different aspects of dataanalysis.
Think of Data Science as the overarching umbrella, covering a wide range of tasks performed to find patterns in large datasets, while Data Analytics is a task that resides under the Data Science umbrella to query, interpret, and visualize datasets. The main goal of Data Analytics is to improve decision-making.
Top 50+ Interview Questions for Data Analysts Technical Questions SQL Queries What is SQL, and why is it necessary for dataanalysis? SQL stands for Structured Query Language, essential for querying and manipulating data stored in relational databases. How would you segment customers based on their purchasing behaviour?
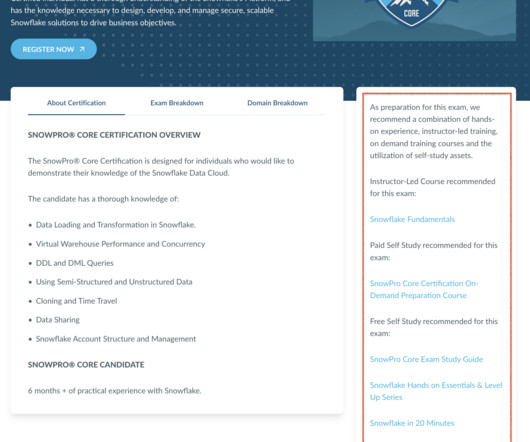
The exam will cover all aspects of using Snowflake and its components to apply dataanalysis principles, from preparing and loading data to presenting data and meeting business requirements. To access these lessons, choose from the links above or go to the Resources tab on the Snowflake home page.
Familiarise yourself with dataanalysis tools such as RStudio, Jupyter Notebook, and Excel. Certifications Consider obtaining certifications like the Certified Bioinformatics Professional (CBP) or the Certified DataScientist (CDS) to demonstrate your expertise. What are Some of the Key Applications of Bioinformatics?
Summary: Leveraging data skills for Financial Analysts explores how Financial Analysts can harness data skills to enhance their roles. It delves into dataanalysis techniques to interpret financial trends effectively, including statistical analysis and data visualization.
We organize all of the trending information in your field so you don't have to. Join 17,000+ users and stay up to date on the latest articles your peers are reading.
You know about us, now we want to get to know you!
Let's personalize your content
Let's get even more personalized
We recognize your account from another site in our network, please click 'Send Email' below to continue with verifying your account and setting a password.


Let's personalize your content