This site uses cookies to improve your experience. To help us insure we adhere to various privacy regulations, please select your country/region of residence. If you do not select a country, we will assume you are from the United States. Select your Cookie Settings or view our Privacy Policy and Terms of Use.
Cookie Settings
Cookies and similar technologies are used on this website for proper function of the website, for tracking performance analytics and for marketing purposes. We and some of our third-party providers may use cookie data for various purposes. Please review the cookie settings below and choose your preference.
Used for the proper function of the website
Used for monitoring website traffic and interactions
Cookie Settings
Cookies and similar technologies are used on this website for proper function of the website, for tracking performance analytics and for marketing purposes. We and some of our third-party providers may use cookie data for various purposes. Please review the cookie settings below and choose your preference.
Strictly Necessary: Used for the proper function of the website
Performance/Analytics: Used for monitoring website traffic and interactions
Designed with simplicity and versatility, it integrates seamlessly with Python’s data ecosystem while offering visually […] The post KitikiPlot: Your New Go-To for Time-Series DataVisualization appeared first on Analytics Vidhya.
Overview matplotlib is a widely used Python library for performing datavisualization and exploratory dataanalysis These 10 matplotlib tricks will enable you to. The post 10 matplotlib Tricks to Master DataVisualization in Python appeared first on Analytics Vidhya.
Overview In this article, we will be dealing with Walmart’s sales dataset and will follow all the dataanalysis steps on the same and as a result, will try to get some business-related insights from the operations we will be performing on this dataset. […].
Introduction DataVisualization is used to present the insights in a given dataset. With meaningful and eye-catching charts, it becomes easier to communicate dataanalysis findings. The post Interactive DataVisualization using rbokeh appeared first on Analytics Vidhya.
Storytelling is more than just datavisualization. Storytelling provides an organized approach for conveying data insights through visuals and narrative. Data-driven storytelling could be used to influence user actions, and ensure they understand what data matters the most.
Microsoft‘s business analytics product, Power BI, delivers interactive datavisualization BI capabilities that allow users to see and share data and insights throughout their organisation. Power BI provides insight data by using data interactively and exploring it by visualizations. […].
This article was published as a part of the Data Science Blogathon Introduction This article will introduce you to the Spotfire Business Intelligence tool for creating interactive visualization, performing dataanalysis, and data science. Spotfire a major player in the BI space is a product from TIBCO.
ArticleVideo Book This article was published as a part of the Data Science Blogathon Introduction Hello, Welcome to the world of EDA using DataVisualization. The post Exploratory DataAnalysis using DataVisualization Techniques! appeared first on Analytics Vidhya.
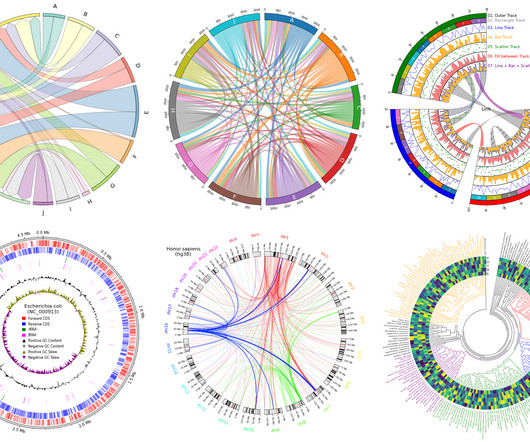
Introduction Artificial Intelligence revolutionizes various fields such as networking, multi-dimensional data exploration, genomics, and sensor dataanalysis, increasing the demand for advanced datavisualization tools.
This article was published as a part of the Data Science Blogathon What is EDA(Exploratory dataanalysis)? Exploratory dataanalysis is a great way of understanding and analyzing the data sets. The post Exploratory DataAnalysis on UBER Stocks Dataset appeared first on Analytics Vidhya.
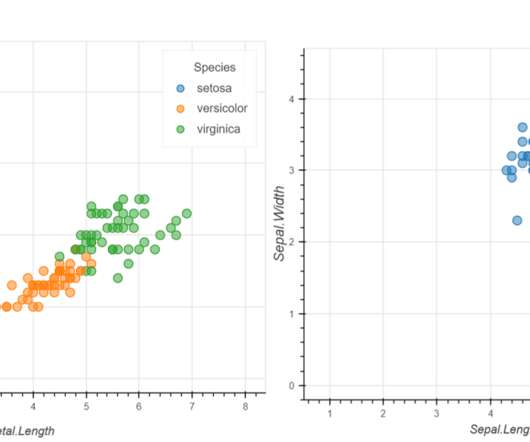
Introduction In dataanalysis, creating visual representations is key to understanding and communicating insights effectively. One tool that shines in Python is ggplot. Built on the grammar of graphics, ggplot offers a straightforward way to make beautiful plots.
ArticleVideo Book This article was published as a part of the Data Science Blogathon Photo by fauxels from Pexels What is Exploratory DataAnalysis? The post Exploratory DataAnalysis and Visualization Techniques in Data Science appeared first on Analytics Vidhya. Exploratory.
Introduction Datavisualization is crucial in Data Analytics. With exploratory dataanalysis (EDA), we gain insights into the hidden trends and patterns in a dataset that are useful for decision-making. The post Interactive DataVisualization Using Bqplot appeared first on Analytics Vidhya.
The post Using DataVisualization to Explore the Human Space Race! Since the dawn of civilization, we have mapped constellations, named planets after Gods and so on. We have seen signs and visions in celestial bodies. In the previous century, we finally had the technology to […]. appeared first on Analytics Vidhya.
The post Guide For DataAnalysis: From Data Extraction to Dashboard appeared first on Analytics Vidhya. Unlike hackathons, where we are supposed to come up with a theme-oriented project within the stipulated time, blogathons are different. Blogathons are competitions that are conducted for over a month […].
Introduction Exploratory DataAnalysis is a method of evaluating or comprehending data in order to derive insights or key characteristics. EDA can be divided into two categories: graphical analysis and non-graphical analysis. EDA is a critical component of any data science or machine learning process.
Introduction to EDA The main objective of this article is to cover the steps involved in Data pre-processing, Feature Engineering, and different stages of Exploratory DataAnalysis, which is an essential step in any research analysis. Data pre-processing, Feature Engineering, and EDA are fundamental early […].
This article was published as a part of the Data Science Blogathon. Introduction Exploratory DataAnalysis(EDA) is one of the most underrated and under-utilized. The post Exploratory DataAnalysis – The Go-To Technique to Explore Your Data! appeared first on Analytics Vidhya.
Introduction Strong libraries like Matplotlib, Seaborn, Plotly, and Bokeh serve as the foundation of Python’s datavisualization ecosystem. Together, they provide a wide range of tools for trend analysis, results presentation, and the creation of dynamic dashboards.
Dataanalysis is an essential process in today’s world of business and science. It involves extracting insights from large sets of data to make informed decisions. One of the most common ways to represent a dataanalysis is through code. However, is code the best way to represent a dataanalysis?
Unlock the full potential of your data with the power of datavisualization! Go through this blog and discover why visualizations are crucial in Data Science and explore the most effective and game-changing types of visualizations that will revolutionize the way you interpret and extract insights from your data.
ArticleVideo Book This article was published as a part of the Data Science Blogathon Introduction Sometimes it is just convenient to leave the driving to. The post Uber and Lyft Cab Prices : DataAnalysis and Visualization appeared first on Analytics Vidhya.
Introduction Exploratory dataanalysis is one of the best practices used in data science today. While starting a career in Data Science, people generally. The post Exploratory DataAnalysis(EDA) from scratch in Python! appeared first on Analytics Vidhya.
ArticleVideos This article was published as a part of the Data Science Blogathon. Introduction Let us walk through the Exploratory DataAnalysis on NYC. The post Exploratory DataAnalysis on NYC Taxi Trip Duration Dataset appeared first on Analytics Vidhya.
ArticleVideo Book This article was published as a part of the Data Science Blogathon. The post Beginners Guide to Explanatory DataAnalysis appeared first on Analytics Vidhya. Introduction As we all know there are certain processes to.
Table of Contents Introduction Working with Dataset Visualizations Results after Analysis Measures to be taken to reduce Terrorism End-Note Introduction Source: [link] In this article, we are going to perform Exploratory DataAnalysis on terrorism dataset to find out the hot zone of terrorism. […].
ArticleVideo Book This article was published as a part of the Data Science Blogathon. Topic to be covered What is Exploratory DataAnalysis What. The post Top Python Libraries to Automate Exploratory DataAnalysis in 2021 appeared first on Analytics Vidhya.
In this blog, we will discuss exploratory dataanalysis, also known as EDA, and why it is important. We will also be sharing code snippets so you can try out different analysis techniques yourself. This can be useful for identifying patterns and trends in the data. So, without any further ado let’s dive right in.
ArticleVideo Book This article was published as a part of the Data Science Blogathon. The post Mastering Exploratory DataAnalysis(EDA) For Data Science Enthusiasts appeared first on Analytics Vidhya. Overview Step by Step approach to Perform EDA Resources Like.
Introduction Exploratory DataAnalysis, or EDA, examines the data and identifies potential relationships between variables using numerical summaries and visualisations. We use summary statistics and graphical tools to get to know our data and understand what we may deduce from them during EDA. […].
The post Exploratory DataAnalysis of Zomato Bangalore Restaurants appeared first on Analytics Vidhya. Introduction With the rise of meal delivery services, everyone can now enjoy their favorite restaurant food from the comfort of their own home. Giant food aggregators and food shipping companies like Zomato have made it feasible.
Datavisualization is an essential tool in the modern landscape of information management, turning complex data into accessible visuals that can facilitate clearer understanding. With the exponential growth of data, the need to effectively interpret vast amounts of information has never been more critical.
Datavisualization is the art of presenting complex information in a way that is easy to understand and analyze. With the explosion of data in today’s business world, the ability to create compelling datavisualizations has become a critical skill for anyone working with data.
The post Exploratory DataAnalysis (EDA) on Lead Scoring Dataset appeared first on Analytics Vidhya. Leads are generally captured by tracking the user’s actions, like how much they visit the website, asking them to fill up some forms, etc. Leads […].
Introduction on DataVisualizationDataVisualization is an interdisciplinary discipline concerned with the visual depiction of data. When the data is large, such as in a time series, it is a very effective manner of communicating.
This article was published as a part of the Data Science Blogathon. Introduction Exploratory DataAnalysis is an approach to discover the insights in. The post How to Improve Your Business With Exploratory DataAnalysis! appeared first on Analytics Vidhya.
ArticleVideo Book This article was published as a part of the Data Science Blogathon Introduction Exploratory DataAnalysis or EDA is a vital step in. The post Using Seaborn’s FacetGrid Based Methods for Exploratory DataAnalysis appeared first on Analytics Vidhya.
Excel has some inbuilt functions which we could use to make our analysis stand out. About the DataAnalysis The data is publicly available on Kaggle. The post End-to-End DataAnalysis Using Microsoft Excel appeared first on Analytics Vidhya.
Introduction The following is an in-depth article explaining DAX which stands for DataAnalysis Expression. DAX is the language developed by Microsoft to interact with data in a variety of their platforms, such as Power BI, PowerPivot, and SSAS tabular models. It is designed to […].
Introduction Exploratory DataAnalysis helps in identifying any outlier data points, understanding the relationships between the various attributes and structure of the data, recognizing the important variables. It helps in framing questions and visualizing the results, paving the way to make an informed choice […].
ArticleVideo Book This article was published as a part of the Data Science Blogathon Overview Python Pandas library is becoming most popular between data scientists. The post EDA – Exploratory DataAnalysis Using Python Pandas and SQL appeared first on Analytics Vidhya.
Introduction Dataanalysis and visualization are powerful tools that enable us to make sense of complex datasets and communicate insights effectively. In this immersive exploration of real-world conflict data, we delve deep into the gritty realities and complexities of conflicts.
ArticleVideo Book This article was published as a part of the Data Science Blogathon Exploratory DataAnalysis, or EDA, is an important step in any. The post Exploratory DataAnalysis (EDA) – A step by step guide appeared first on Analytics Vidhya.
We organize all of the trending information in your field so you don't have to. Join 17,000+ users and stay up to date on the latest articles your peers are reading.
You know about us, now we want to get to know you!
Let's personalize your content
Let's get even more personalized
We recognize your account from another site in our network, please click 'Send Email' below to continue with verifying your account and setting a password.


Let's personalize your content