This site uses cookies to improve your experience. To help us insure we adhere to various privacy regulations, please select your country/region of residence. If you do not select a country, we will assume you are from the United States. Select your Cookie Settings or view our Privacy Policy and Terms of Use.
Cookie Settings
Cookies and similar technologies are used on this website for proper function of the website, for tracking performance analytics and for marketing purposes. We and some of our third-party providers may use cookie data for various purposes. Please review the cookie settings below and choose your preference.
Used for the proper function of the website
Used for monitoring website traffic and interactions
Cookie Settings
Cookies and similar technologies are used on this website for proper function of the website, for tracking performance analytics and for marketing purposes. We and some of our third-party providers may use cookie data for various purposes. Please review the cookie settings below and choose your preference.
Strictly Necessary: Used for the proper function of the website
Performance/Analytics: Used for monitoring website traffic and interactions
Data Analyst Data analysts are responsible for collecting, analyzing, and interpreting large sets of data to identify patterns and trends. They require strong analytical skills, knowledge of statistical analysis, and expertise in datavisualization.
The goal of data cleaning, the data cleaning process, selecting the best programming language and libraries, and the overall methodology and findings will all be covered in this post. Datawrangling requires that you first clean the data. Getting Started First, we need to import the necessary libraries.
They offer the ability to challenge one’s knowledge and get hands-on practice to boost their skills in areas, including, but not limited to, exploratory dataanalysis, datavisualization, datawrangling, machine learning, and everything essential to learning data science.
It involves data collection, cleaning, analysis, and interpretation to uncover patterns, trends, and correlations that can drive decision-making. The rise of machine learning applications in healthcare Data scientists, on the other hand, concentrate on dataanalysis and interpretation to extract meaningful insights.
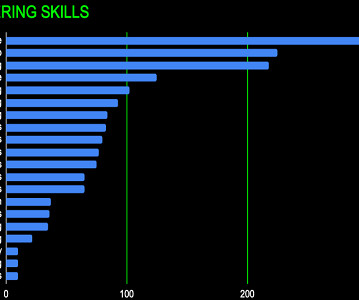
If you are considering a data analyst career, here are some reasons that may help solidify your decision. Unsurprisingly, those pursuing careers in dataanalysis are highly sought after. As a data analyst, you will learn several technical skills that data analysts need to be successful, including: Programming skills.
They offer the ability to challenge one’s knowledge and get hands-on practice to boost their skills in areas, including, but not limited to, exploratory dataanalysis, datavisualization, datawrangling, machine learning, and everything essential to learning data science.
Analytics and DataAnalysis Coming in as the 4th most sought-after skill is data analytics, as many data scientists will be expected to do some analysis in their careers. Workflow pipelines are integral to data engineering, so platforms like Kubernetes, Luigi, and Docker are all desirable for building pipelines.
Empowering Data Scientists and Engineers with Lightning-Fast DataAnalysis and Transformation Capabilities Photo by Hans-Jurgen Mager on Unsplash ?Goal Abstract Polars is a fast-growing open-source data frame library that is rapidly becoming the preferred choice for data scientists and data engineers in Python.
You can perform dataanalysis within SQL Though mentioned in the first example, let’s expand on this a bit more. SQL allows for some pretty hefty and easy ad-hoc dataanalysis for the data professional on the go. Imagine combining the data power of SQL with your preferred scripting program.
Introduction to Pandas – The fundamentals Pandas is a popular and powerful open-source dataanalysis and manipulation library for the Python programming language. It is used by us, almighty data scientists and analysts to work with large datasets, perform complex operations, and create powerful datavisualizations.
Overview: Data science vs data analytics Think of data science as the overarching umbrella that covers a wide range of tasks performed to find patterns in large datasets, structure data for use, train machine learning models and develop artificial intelligence (AI) applications.
The main things are Performance, Prediction, Summary View’s Correlation Mode, Text DataWrangling UI, and Summarize Table. Performance But the performance to me is probably the most important feature for any dataanalysis tools. Switching between Data Frames. Moving between the DataWrangling Steps.
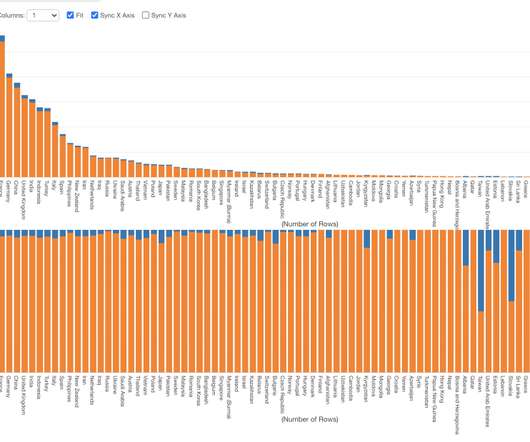
We looked at over 25,000 job descriptions, and these are the data analytics platforms, tools, and skills that employers are looking for in 2023. Excel is the second most sought-after tool in our chart as you’ll see below as it’s still an industry standard for data management and analytics.
Data science equips you with the tools and techniques to manage big data, perform exploratory dataanalysis, and extract meaningful information from complex datasets. Making data-driven decisions: Data science empowers you to make informed decisions by analyzing and interpreting data.
As a programming language it provides objects, operators and functions allowing you to explore, model and visualise data. The programming language can handle Big Data and perform effective dataanalysis and statistical modelling. R’s workflow support enhances productivity and collaboration among data scientists.
Enroll in data science courses or bootcamps: Participating in structured data science programs specifically designed for non-technical backgrounds can provide you with a comprehensive understanding of the field. Look for programs that cover topics such as machine learning, datavisualization, and predictive modeling.
DataAnalysis Include charts, graphs, or tables to visually represent trends and insights. Interpretation and Insights Explain the meaning behind the data and visuals. Step 3: Formula Power: Unlocking Data Insights Excel boasts a robust library of formulas that can analyze and summarize your data.
Descriptive Analytics Projects: These projects focus on summarizing historical data to gain insights into past trends and patterns. Examples include generating reports, dashboards, and datavisualizations to understand business performance, customer behavior, or operational efficiency.
Data science methodologies and skills can be leveraged to design these experiments, analyze results, and iteratively improve prompt strategies. Using skills such as statistical analysis and datavisualization techniques, prompt engineers can assess the effectiveness of different prompts and understand patterns in the responses.
Humans and machines Data scientists and analysts need to be aware of how this technology will affect their role, their processes, and their relationships with other stakeholders. There are clearly aspects of datawrangling that AI is going to be good at.
We organize all of the trending information in your field so you don't have to. Join 17,000+ users and stay up to date on the latest articles your peers are reading.
You know about us, now we want to get to know you!
Let's personalize your content
Let's get even more personalized
We recognize your account from another site in our network, please click 'Send Email' below to continue with verifying your account and setting a password.


Let's personalize your content