This site uses cookies to improve your experience. To help us insure we adhere to various privacy regulations, please select your country/region of residence. If you do not select a country, we will assume you are from the United States. Select your Cookie Settings or view our Privacy Policy and Terms of Use.
Cookie Settings
Cookies and similar technologies are used on this website for proper function of the website, for tracking performance analytics and for marketing purposes. We and some of our third-party providers may use cookie data for various purposes. Please review the cookie settings below and choose your preference.
Used for the proper function of the website
Used for monitoring website traffic and interactions
Cookie Settings
Cookies and similar technologies are used on this website for proper function of the website, for tracking performance analytics and for marketing purposes. We and some of our third-party providers may use cookie data for various purposes. Please review the cookie settings below and choose your preference.
Strictly Necessary: Used for the proper function of the website
Performance/Analytics: Used for monitoring website traffic and interactions
To address this challenge, businesses need to use advanced dataanalysis methods. These methods can help businesses to make sense of their data and to identify trends and patterns that would otherwise be invisible. In recent years, there has been a growing interest in the use of artificial intelligence (AI) for dataanalysis.
From uncovering hidden patterns to providing actionable recommendations, generative AI’s proficiency in data analytics heralds a new era where innovation spans the spectrum from artistic expression to informed business strategies. So let’s take a brief look at some examples of how generative AI can be used for data analytics.
While it has always been a data-intensive process, enterprise fraud management today is more complex and more important than ever. This blog post explores the evolving role of enterprise fraud management, examines the impact of AI and showcases the importance of visualdataanalysis. What is enterprise fraud management?
In this blog post, Ill show how effective log datavisualization improves your enterprise observability workflows. Youll see how KronoGraph, our timeline visualization SDK , can work alongside your log table, or replace it entirely. With KronoGraph log datavisualization, observing log sources becomes instantaneous.
Artificial intelligence is changing the way organizations think about dataanalysis. AI and datavisualization can do a lot of the heavy lifting for analysts and investigators working with connected data – helping them detect, understand and even predict risks and threats.
Working with data is a necessity for most jobs, and analytical skills can be a huge differentiator for success across all kinds of work—whether corporate, nonprofit, or academic. Without closing the data skills gap, these challenges would continue into their professional lives.
You can perform dataanalysis within SQL Though mentioned in the first example, let’s expand on this a bit more. SQL allows for some pretty hefty and easy ad-hoc dataanalysis for the data professional on the go. Imagine combining the data power of SQL with your preferred scripting program.
They are being increasingly challenged to improve efficiency and cost savings, embrace automation, and engage in data-driven decision making that helps their organization stand out from the competition. Streams of business events provide users with a persistent, continuously updated record of their data, as it is being generated.
ODSC East is coming to Boston this April and bringing leading experts in everything from generative AI and LLMs to dataanalysis to the home of countless AI startups and MIT alike. Virtual attendees will also have the opportunity to connect with our partners at the virtual AI Expo and Demo Hall.
The challenge to understand hidden relationships and uncover actionable insights from data is universal, across countless datavisualization use cases. In this blog post, we focus on seven of the most popular: Why visualizedata as a graph? Datavisualization makes it easy for us to identify trends and outliers.
We looked at over 25,000 job descriptions, and these are the data analytics platforms, tools, and skills that employers are looking for in 2023. Excel is the second most sought-after tool in our chart as you’ll see below as it’s still an industry standard for data management and analytics.
Submit Data. After Exploratory DataAnalysis is completed, you can look at your data. Get Started for Free or reach out to our team to request a demo. See Visual AI in Action Today. The post Get Maximum Value from Your VisualData appeared first on DataRobot AI Cloud. Interested to learn more?
Working with data is a necessity for most jobs, and analytical skills can be a huge differentiator for success across all kinds of work—whether corporate, nonprofit, or academic. Without closing the data skills gap, these challenges would continue into their professional lives.
At every stage of an investigation workflow, the analysts need to understand the underlying story – or narrative – of the data they’re working with. Once an analyst understands that data narrative, they need to explain it to teammates, stakeholders and others. FREE: Start your trial today Visualize your data!
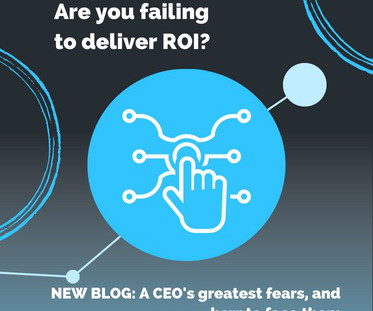
You’ll find links to each survey below And because we’re the leading supplier of datavisualization toolkits that make the world safer, I’ll also share what we’re doing to help the CEOs of the most successful global organizations we work with. Visualization transforms the data into something that anyone can explore and understand.
Using sophisticated datavisualization tools, many of which are powered by AI, app analytics services empower businesses to better understand IT operations , helping teams make smarter decisions, faster. AI in SaaS analytics Most industries have had to reckon with AI proliferation and AI-driven business practices to some extent.
FREE: Managing fraud The ultimate guide to fraud detection, investigation and prevention using datavisualization GET YOUR FREE GUIDE The role of new & existing technology For many years, credit card companies have relied on analytics, algorithms and decision trees to power their fraud strategy.
Datavisualization is the quickest and most powerful way to give organizations a deeper understanding of their connected data. Our visualization toolkits have been used in countless critical use cases including fraud detection, law enforcement and security, cyber security, infrastructure management and regulatory compliance.
I did not realize as Chris demoed his prototype PhD system that it would become Tableau Desktop , a product used today by millions of people around the world to see and understand data, including in Fortune 500 companies, classrooms, and nonprofit organizations. Oct 2005) with a feature called Show Me.
This comprehensive blog outlines vital aspects of Data Analyst interviews, offering insights into technical, behavioural, and industry-specific questions. It covers essential topics such as SQL queries, datavisualization, statistical analysis, machine learning concepts, and data manipulation techniques.
After the completion of the course, they can perform dataanalysis and build products using R. These include the following: Introduction to Data Science Introduction to Python SQL for DataAnalysis Statistics DataVisualization with Tableau 5. Data Science Program for working professionals by Pickl.AI
I did not realize as Chris demoed his prototype PhD system that it would become Tableau Desktop , a product used today by millions of people around the world to see and understand data, including in Fortune 500 companies, classrooms, and nonprofit organizations. Oct 2005) with a feature called Show Me.
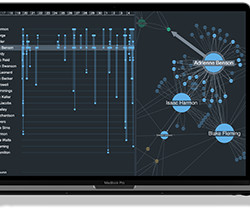
Each image and animation demonstrates what you can achieve with our datavisualization toolkits. Why do investigators rely on link analysis techniques? 6 popular link analysis techniques 1. Zooming into the datavisualization immediately uncovers sequences and anomalies that might indicate suspicious behavior.
To build such a model, starting from an historical rental’s dataset, we are going to perform some dataanalysis and experiments in a Python Jupyter notebook on VS Code. Now let’s move further and let’s do some datavisualization.
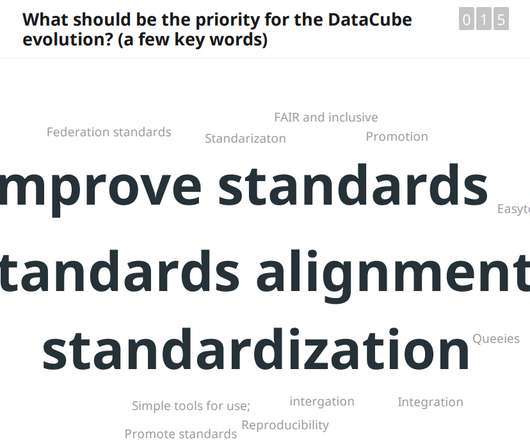
How can we all make environmental data more usable, accessible and more relevant? Presentations include demos of functionality and proposals for the future development work, primarily funded by the Horizon Europe programme. For example, vector maps of roads of an area coming from different sources is the raw data.
We organize all of the trending information in your field so you don't have to. Join 17,000+ users and stay up to date on the latest articles your peers are reading.
You know about us, now we want to get to know you!
Let's personalize your content
Let's get even more personalized
We recognize your account from another site in our network, please click 'Send Email' below to continue with verifying your account and setting a password.


Let's personalize your content