This site uses cookies to improve your experience. To help us insure we adhere to various privacy regulations, please select your country/region of residence. If you do not select a country, we will assume you are from the United States. Select your Cookie Settings or view our Privacy Policy and Terms of Use.
Cookie Settings
Cookies and similar technologies are used on this website for proper function of the website, for tracking performance analytics and for marketing purposes. We and some of our third-party providers may use cookie data for various purposes. Please review the cookie settings below and choose your preference.
Used for the proper function of the website
Used for monitoring website traffic and interactions
Cookie Settings
Cookies and similar technologies are used on this website for proper function of the website, for tracking performance analytics and for marketing purposes. We and some of our third-party providers may use cookie data for various purposes. Please review the cookie settings below and choose your preference.
Strictly Necessary: Used for the proper function of the website
Performance/Analytics: Used for monitoring website traffic and interactions
Introduction Dataanalysis and visualization are powerful tools that enable us to make sense of complex datasets and communicate insights effectively. In this immersive exploration of real-world conflict data, we delve deep into the gritty realities and complexities of conflicts.
That’s akin to the experience of sifting through today’s digital news landscape, except instead of a magical test, we have the power of dataanalysis to help us find the news that matters most to us.
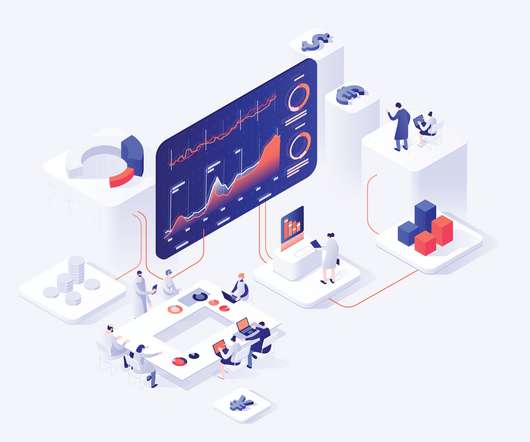
There is no disputing the fact that the collection and analysis of massive amounts of unstructured data has been a huge breakthrough. We would like to talk about datavisualization and its role in the big data movement. Data is useless without the opportunity to visualize what we are looking for.
For instance, Berkeley’s Division of Data Science and Information points out that entry level data science jobs remote in healthcare involves skills in NLP (Natural Language Processing) for patient and genomic dataanalysis, whereas remote data science jobs in finance leans more on skills in risk modeling and quantitative analysis.
Probability distributions: Probability distributions serve as foundational concepts in statistics and mathematics, providing a structured framework for characterizing the probabilities of various outcomes in random events. It’s like examining the historical trajectory of a variable to understand its patterns and trends.
The conference features keynote presentations, panel discussions, and breakout sessions on topics such as big data, data governance, datavisualization, artificial intelligence, and machine learning. The conference takes place annually in Santa Clara, California, United States. PAW Climate and Deep Learning World.
This article was published as a part of the Data Science Blogathon Introduction A news article discusses current or recent news of either general interest (i.e. A news article can include accounts of eyewitnesses to the happening event. […]. daily newspapers) or on a specific topic (i.e.
A data scientist could analyze sales data, customer surveys, and social media trends to determine the reason. They might find that it’s because of a popular deal or event on Tuesdays. Data Cleaning and Preprocessing Before analyzing data, it often needs a cleanup. It’s like deciphering a secret code.
Summary: DataAnalysis focuses on extracting meaningful insights from raw data using statistical and analytical methods, while datavisualization transforms these insights into visual formats like graphs and charts for better comprehension. Is DataAnalysis just about crunching numbers?
While it has always been a data-intensive process, enterprise fraud management today is more complex and more important than ever. This blog post explores the evolving role of enterprise fraud management, examines the impact of AI and showcases the importance of visualdataanalysis. What is enterprise fraud management?
From uncovering hidden patterns to providing actionable recommendations, generative AI’s proficiency in data analytics heralds a new era where innovation spans the spectrum from artistic expression to informed business strategies. So let’s take a brief look at some examples of how generative AI can be used for data analytics.
Stress can be triggered by a variety of factors, such as work-related pressure, financial difficulties, relationship problems, health issues, or major life events. […] The post Machine Learning Unlocks Insights For Stress Detection appeared first on Analytics Vidhya.
Through each exercise, you’ll learn important data science skills as well as “best practices” for using pandas. By the end of the tutorial, you’ll be more fluent at using pandas to correctly and efficiently answer your own data science questions. Table of Contents: Exploratory DataAnalysis is all about answering a specific question.
This is where a data workflow is essential, allowing you to turn your raw data into actionable insights. In this article, well explore how that workflow covering aspects from data collection to datavisualizations can tackle the real-world challenges. Tracking Data: Player movements and positioning.
To meet these objectives, business and data professionals need to go beyond cookie-cutter business intelligence, datavisualization dashboards and data analytics tools. Advantages of event-driven solutions This is where event-driven solutions excel. 3 reasons to take advantage of event-driven solutions 1.
Companies use Business Intelligence (BI), Data Science , and Process Mining to leverage data for better decision-making, improve operational efficiency, and gain a competitive edge. A Data Product can take various forms, depending on the domain’s requirements and the data it manages.
A data scientist could analyze sales data, customer surveys, and social media trends to determine the reason. They might find that it’s because of a popular deal or event on Tuesdays. It’s like the detective’s toolkit, providing the tools to analyze and interpret data.
Synapse Real-Time Intelligence: Real-Time Intelligence in Synapse provides a robust solution to gain insights and visualizeevent-driven scenarios and streaming data logs. Power BI: Power BI, integrated within Microsoft Fabric, is a leading Business Intelligence tool that facilitates advanced datavisualization and reporting.
In this blog post, Ill show how effective log datavisualization improves your enterprise observability workflows. Youll see how KronoGraph, our timeline visualization SDK , can work alongside your log table, or replace it entirely. With KronoGraph log datavisualization, observing log sources becomes instantaneous.
Line plots are easy to understand, versatile, and can be used to visualize different types of data, making them useful tools in dataanalysis and communication. With `Matplotlib`, you can customize your plots with various colors, line styles, and markers to make them more visually appealing and informative.
In the world of datavisualization , the ability to produce material that can speak to your audience, regardless of their technical expertise, is an ever-important factor to consider. Tableau Public Tableau Public , a powerful datavisualization software, empowers users to create interactive and shareable dashboards with ease.
Ticket reservation: The Ticket Reservation project revolves around creating a straightforward system for reserving tickets for events or travel purposes. Using Python, learners can build a command-line or GUI application that allows users to browse available events or travel options and book tickets for specific dates and seats.
Data science bootcamps are intensive short-term educational programs designed to equip individuals with the skills needed to enter or advance in the field of data science. They cover a wide range of topics, ranging from Python, R, and statistics to machine learning and datavisualization.
Making visualizations is one of the finest ways for data scientists to explain dataanalysis to people outside the business. Exploratory dataanalysis can help you comprehend your data better, which can aid in future data preprocessing. Exploratory DataAnalysis What is EDA?
We decided to cover some of the most important differences between Data Mining vs Data Science in order to finally understand which is which. What is Data Science? Data Science is an activity that focuses on dataanalysis and finding the best solutions based on it. Where to Use Data Science?
To democratize data, organizations need to provide people with the tools and resources they need to access, analyze, and draw insights from data. The ultimate goal of data democratization is to create a more open and transparent culture around data, where everyone has access to the information they need to make informed decisions.
We also indicated the onset of the Covid-19 emergency on most visualizations to suggest how external events may affect women’s incarceration. Apart from the IDOC data, Illinois geographical data are also collected for a map indicating the distribution of women’s prison and parole populations by regions in IL.
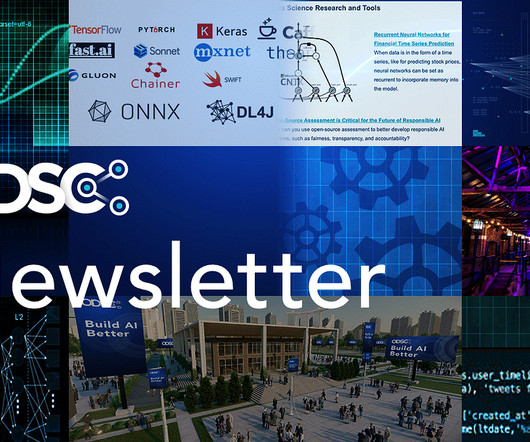
Data Analytics in the Age of AI, When to Use RAG, Examples of DataVisualization with D3 and Vega, and ODSC East Selling Out Soon Data Analytics in the Age of AI Let’s explore the multifaceted ways in which AI is revolutionizing data analytics, making it more accessible, efficient, and insightful than ever before.
In data science, use linear algebra for understanding the statistical graphs. Probability is the measurement of the likelihood of events. Probability distributions are collections of all events and their probabilities. Knowledge of probability distributions is needed for understanding and predicting data. Probability.
Inspired by the wildly popular Iron Viz competition from Tableau Conference, Viz Games are an exciting and fun way for any organization to take their skills to the next level while expanding data culture and engagement on dataanalysis. All visualizations were published on Tableau Public.
Multi-cloud support : Fabric’s support for multi-cloud environments, including shortcuts that virtualize data lake storage across different cloud providers, allows seamless incorporation of diverse data sources into Power BI for comprehensive analysis.
Inspired by the wildly popular Iron Viz competition from Tableau Conference, Viz Games are an exciting and fun way for any organization to take their skills to the next level while expanding data culture and engagement on dataanalysis. All visualizations were published on Tableau Public.
Dominic is one of the Co-Founders of StoryIQ and a TEDx speaker, and possess a wealth of data storytelling experience from StoryIQ, an organization that specializes in enhancing data literacy skills, data storytelling skills, and datavisualization techniques to empower individuals and teams in making informed, data-driven decisions.
Using a step-by-step approach, he demonstrated how to integrate AI models with structured databases, enabling automated insights generation, query execution, and datavisualization. Attendees left with a clear understanding of how AI can enhance dataanalysis workflows and improve decision-making in business intelligence applications.
Imagine data scientists as modern-day detectives who sift through a sea of information to uncover hidden patterns, trends, and correlations that can inform decision-making and drive innovation. A model builder: Data scientists create models that simulate real-world processes. Work Works with larger, more complex data sets.
By acquiring expertise in statistical techniques, machine learning professionals can develop more advanced and sophisticated algorithms, which can lead to better outcomes in dataanalysis and prediction. These techniques can be utilized to estimate the likelihood of future events and inform the decision-making process.
You will be listening to the requirements of the clients, combining this with the data, and matching them up with the most appropriate solutions. Business analysts are concerned with looking at data and events, making sure negative events do not occur again and choosing and implementing solutions to ensure that this is the case.
Without this library, dataanalysis wouldn’t be the same without pandas, which reign supreme with its powerful data structures and manipulation tools. Pandas provides a fast and efficient way to work with tabular data. It is widely used in data science, finance, and other fields where dataanalysis is essential.
We’ll be covering a wide range of topics from generative AI and LLMs to datavisualization and data literacy. To help us understand and learn the skills of data storytelling and data literacy, we’ve invited Dominic Bohen to join us. Dominic Bohen brings a wealth of data storytelling experience.
To democratize data, organizations need to provide people with the tools and resources they need to access, analyze, and draw insights from data. The ultimate goal of data democratization is to create a more open and transparent culture around data, where everyone has access to the information they need to make informed decisions.
Overview: Data science vs data analytics Think of data science as the overarching umbrella that covers a wide range of tasks performed to find patterns in large datasets, structure data for use, train machine learning models and develop artificial intelligence (AI) applications.
The challenge to understand hidden relationships and uncover actionable insights from data is universal, across countless datavisualization use cases. In this blog post, we focus on seven of the most popular: Why visualizedata as a graph? Datavisualization makes it easy for us to identify trends and outliers.
ODSC East is coming to Boston this April and bringing leading experts in everything from generative AI and LLMs to dataanalysis to the home of countless AI startups and MIT alike. You can also get data science training on-demand wherever you are with our Ai+ Training platform. Interested in attending an ODSC event?
This step is crucial for eliminating inconsistencies and ensuring data integrity. DataAnalysisDataanalysis is the heart of deriving insights from the gathered information. DataVisualizationDatavisualization transforms complex data sets into intuitive and visually appealing representations.
We organize all of the trending information in your field so you don't have to. Join 17,000+ users and stay up to date on the latest articles your peers are reading.
You know about us, now we want to get to know you!
Let's personalize your content
Let's get even more personalized
We recognize your account from another site in our network, please click 'Send Email' below to continue with verifying your account and setting a password.


Let's personalize your content