This site uses cookies to improve your experience. To help us insure we adhere to various privacy regulations, please select your country/region of residence. If you do not select a country, we will assume you are from the United States. Select your Cookie Settings or view our Privacy Policy and Terms of Use.
Cookie Settings
Cookies and similar technologies are used on this website for proper function of the website, for tracking performance analytics and for marketing purposes. We and some of our third-party providers may use cookie data for various purposes. Please review the cookie settings below and choose your preference.
Used for the proper function of the website
Used for monitoring website traffic and interactions
Cookie Settings
Cookies and similar technologies are used on this website for proper function of the website, for tracking performance analytics and for marketing purposes. We and some of our third-party providers may use cookie data for various purposes. Please review the cookie settings below and choose your preference.
Strictly Necessary: Used for the proper function of the website
Performance/Analytics: Used for monitoring website traffic and interactions
In this blog, we will discuss exploratory dataanalysis, also known as EDA, and why it is important. We will also be sharing code snippets so you can try out different analysis techniques yourself. EDA is an iterative process of conglomerative activities which include data cleaning, manipulation and visualization.
It is practically impossible to test it on every single member of the population. Inferential statistics employ techniques such as hypothesistesting and regression analysis (also discussed later) to determine the likelihood of observed patterns occurring by chance and to estimate population parameters.
The good news is that you don’t need to be an engineer, scientist, or programmer to acquire the necessary dataanalysis skills. Whether you’re located anywhere in the world or belong to any profession, you can still develop the expertise needed to be a skilled data analyst. Who are data analysts?
It involves data collection, cleaning, analysis, and interpretation to uncover patterns, trends, and correlations that can drive decision-making. The rise of machine learning applications in healthcare Data scientists, on the other hand, concentrate on dataanalysis and interpretation to extract meaningful insights.
Photo by Joshua Sortino on Unsplash Dataanalysis is an essential part of any research or business project. Before conducting any formal statistical analysis, it’s important to conduct exploratory dataanalysis (EDA) to better understand the data and identify any patterns or relationships.
Steps to Perform DataVisualization: Datavisualization is the presentation of information and statistics using visual tools that include charts, graphs, and maps. Its goal is to create patterns in data, trends, and anomalies comprehensible to both data professionals and people without technical knowledge.
Summary: The Data Science and DataAnalysis life cycles are systematic processes crucial for uncovering insights from raw data. Quality data is foundational for accurate analysis, ensuring businesses stay competitive in the digital landscape. billion INR by 2026, with a CAGR of 27.7%.
Data science bootcamps are intensive short-term educational programs designed to equip individuals with the skills needed to enter or advance in the field of data science. They cover a wide range of topics, ranging from Python, R, and statistics to machine learning and datavisualization.
Here, we will delve into the seven primary characteristics of statistics, providing insights into how they contribute to effective DataAnalysis. Key Takeaways Central tendency summarises data with mean, median, and mode. Variability measures data spread through range and standard deviation.
A well-organized portfolio demonstrates your ability to work with data and draw valuable insights. Here are the steps to build an impressive data analyst portfolio: Select Relevant Projects: Choose a variety of dataanalysis projects that highlight your skills and cover different aspects of dataanalysis.
Clean and preprocess data to ensure its quality and reliability. Statistical Analysis: Apply statistical techniques to analyse data, including descriptive statistics, hypothesistesting, regression analysis, and machine learning algorithms.
Statistics In the field of machine learning, tools and tables play a critical role in creating models from data. Additionally, statistics and its various branches, including analysis of variance and hypothesistesting, are fundamental in building effective algorithms. R is especially popular in academia and research.
Proficient in programming languages like Python or R, data manipulation libraries like Pandas, and machine learning frameworks like TensorFlow and Scikit-learn, data scientists uncover patterns and trends through statistical analysis and datavisualization. DataVisualization: Matplotlib, Seaborn, Tableau, etc.
As a programming language it provides objects, operators and functions allowing you to explore, model and visualise data. The programming language can handle Big Data and perform effective dataanalysis and statistical modelling. R’s workflow support enhances productivity and collaboration among data scientists.
This step is crucial for eliminating inconsistencies and ensuring data integrity. DataAnalysisDataanalysis is the heart of deriving insights from the gathered information. DataVisualizationDatavisualization transforms complex data sets into intuitive and visually appealing representations.
Here are some of the most common backgrounds that prepare you well: Mathematics and Statistics These disciplines provide a rock-solid understanding of dataanalysis, probability theory, statistical modelling, and hypothesistesting – all essential tools for extracting meaning from data.
This comprehensive blog outlines vital aspects of Data Analyst interviews, offering insights into technical, behavioural, and industry-specific questions. It covers essential topics such as SQL queries, datavisualization, statistical analysis, machine learning concepts, and data manipulation techniques.
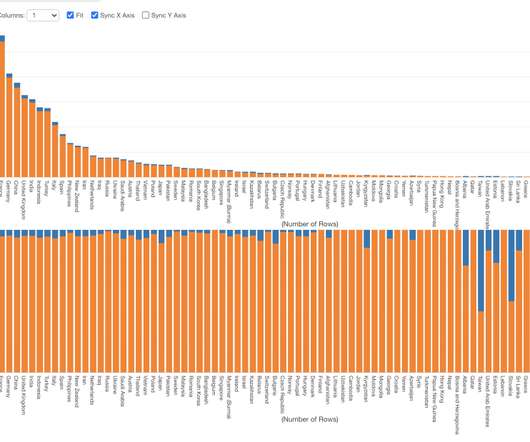
The main things are Performance, Prediction, Summary View’s Correlation Mode, Text Data Wrangling UI, and Summarize Table. Performance But the performance to me is probably the most important feature for any dataanalysis tools. Summary View The summary view is the first thing you see once you import your data into Exploratory.
As a part of the Data Science Course with Placement Guarantee , you will gain expertise in all these skill sets. A holistic Data Science course will prepare you for a professional setting.
Summary: The fundamentals of statisticsdescriptive statistics, probability, inferential analysis, correlation, and data visualisationempower individuals to analyse data effectively and make informed decisions. Businesses and researchers can minimise uncertainty and make data-driven decisions using inferential statistics.
Once the exploratory steps are completed, the cleansed data is subjected to various algorithms like predictive analysis, regression, text mining, recognition patterns, etc depending on the requirements. In the final stage, the results are communicated to the business in a visually appealing manner.
We organize all of the trending information in your field so you don't have to. Join 17,000+ users and stay up to date on the latest articles your peers are reading.
You know about us, now we want to get to know you!
Let's personalize your content
Let's get even more personalized
We recognize your account from another site in our network, please click 'Send Email' below to continue with verifying your account and setting a password.


Let's personalize your content