This site uses cookies to improve your experience. To help us insure we adhere to various privacy regulations, please select your country/region of residence. If you do not select a country, we will assume you are from the United States. Select your Cookie Settings or view our Privacy Policy and Terms of Use.
Cookie Settings
Cookies and similar technologies are used on this website for proper function of the website, for tracking performance analytics and for marketing purposes. We and some of our third-party providers may use cookie data for various purposes. Please review the cookie settings below and choose your preference.
Used for the proper function of the website
Used for monitoring website traffic and interactions
Cookie Settings
Cookies and similar technologies are used on this website for proper function of the website, for tracking performance analytics and for marketing purposes. We and some of our third-party providers may use cookie data for various purposes. Please review the cookie settings below and choose your preference.
Strictly Necessary: Used for the proper function of the website
Performance/Analytics: Used for monitoring website traffic and interactions
This article was published as a part of the Data Science Blogathon. The post The Clever Ingredient that decides the rise and the fall of your MachineLearning Model- Exploratory DataAnalysis appeared first on Analytics Vidhya. Introduction Well! We all love cakes. If you take a deeper look.
Overview In this article, we will be analyzing the flight fare prediction using MachineLearning dataset using essential exploratory dataanalysis techniques then will draw some predictions about the price of the flight based on some features such as what type of airline it […].
Introduction Exploratory DataAnalysis is a method of evaluating or comprehending data in order to derive insights or key characteristics. EDA can be divided into two categories: graphical analysis and non-graphical analysis. EDA is a critical component of any data science or machinelearning process.
Dataanalysis is an essential process in today’s world of business and science. It involves extracting insights from large sets of data to make informed decisions. One of the most common ways to represent a dataanalysis is through code. However, is code the best way to represent a dataanalysis?
Introduction In the realm of data science, the initial step towards understanding and analyzing data involves a comprehensive exploratory dataanalysis (EDA). This process is pivotal for recognizing patterns, identifying anomalies, and establishing hypotheses.
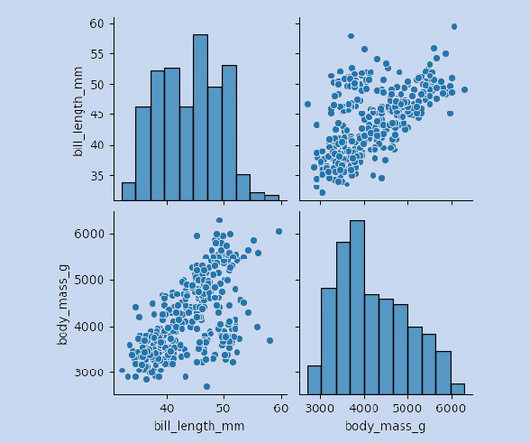
Introduction In dataanalysis, creating visual representations is key to understanding and communicating insights effectively. One tool that shines in Python is ggplot. Built on the grammar of graphics, ggplot offers a straightforward way to make beautiful plots.
Introduction Datavisualization (DV) plays a crucial role in analyzing and interpreting data. With the growing importance of data science and machinelearning, dataanalysis holds a special place in […] The post Creating Interactive and Animated Charts with ipyvizzu appeared first on Analytics Vidhya.
Introduction Exploratory DataAnalysis, or EDA, examines the data and identifies potential relationships between variables using numerical summaries and visualisations. We use summary statistics and graphical tools to get to know our data and understand what we may deduce from them during EDA. […].
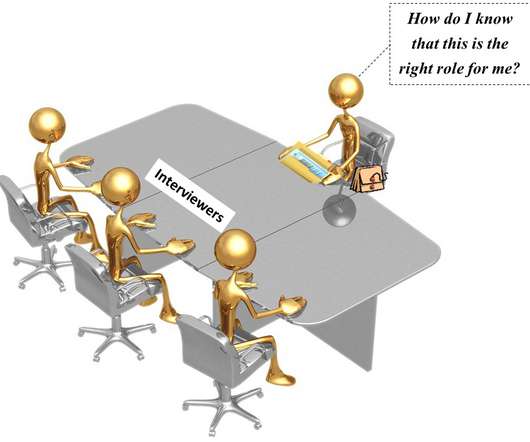
This article was published as a part of the Data Science Blogathon. Introduction You may be asked questions on various topics in a data science interview. These include statistics, machinelearning, probability, datavisualization, dataanalysis, and behavioral questions.
Stress can be triggered by a variety of factors, such as work-related pressure, financial difficulties, relationship problems, health issues, or major life events. […] The post MachineLearning Unlocks Insights For Stress Detection appeared first on Analytics Vidhya.
ChatGPT can also use Wolfram Language to perform more complex tasks, such as simulating physical systems or training machinelearning models. Deploy machinelearning Models: You can use the plugin to train and deploy machinelearning models. Source: ScholarAI Experiment with ChatGPT now!
For instance, Berkeley’s Division of Data Science and Information points out that entry level data science jobs remote in healthcare involves skills in NLP (Natural Language Processing) for patient and genomic dataanalysis, whereas remote data science jobs in finance leans more on skills in risk modeling and quantitative analysis.
This instructor-led live training course is designed for individuals who want to learn how to use Python to perform dataanalysis, visualization, and manipulation. Python is a powerful programming language used in data science, machinelearning, and artificial intelligence.
Introduction R is a powerful and versatile programming language used for statistical analysis, datavisualization, and machinelearning. The success of a dataanalysis project relies on properly importing the data into R.
Introduction Exploratory DataAnalysis helps in identifying any outlier data points, understanding the relationships between the various attributes and structure of the data, recognizing the important variables. It helps in framing questions and visualizing the results, paving the way to make an informed choice […].
To address this challenge, businesses need to use advanced dataanalysis methods. These methods can help businesses to make sense of their data and to identify trends and patterns that would otherwise be invisible. In recent years, there has been a growing interest in the use of artificial intelligence (AI) for dataanalysis.
Photo by Mahdis Mousavi on Unsplash Do you want to get into machinelearning? I have been in the Data field for over 8 years, and MachineLearning is what got me interested then, so I am writing about this! Youll learn faster than any tutorial can teach you. Forget deep learning for now.
Photo by Mahdis Mousavi on Unsplash Do you want to get into machinelearning? I have been in the Data field for over 8 years, and MachineLearning is what got me interested then, so I am writing about this! Youll learn faster than any tutorial can teach you. Forget deep learning for now.
Introduction Datavisualization is a pivotal aspect of dataanalysis, offering an intuitive understanding of complex data through graphical representation.
Data Scientist Data scientists are responsible for designing and implementing data models, analyzing and interpreting data, and communicating insights to stakeholders. They require strong programming skills, knowledge of statistical analysis, and expertise in machinelearning.
That’s akin to the experience of sifting through today’s digital news landscape, except instead of a magical test, we have the power of dataanalysis to help us find the news that matters most to us.
Libraries and Tools: Libraries like Pandas, NumPy, Scikit-learn, Matplotlib, Seaborn, and Tableau are like specialized tools for dataanalysis, visualization, and machinelearning. Data Cleaning and Preprocessing Before analyzing data, it often needs a cleanup.
One of the main reasons for its popularity is the vast array of libraries and packages available for data manipulation, analysis, and visualization. It supports large, multi-dimensional arrays and matrices of numerical data, as well as a large library of mathematical functions to operate on these arrays.
The ML stack is an essential framework for any data scientist or machinelearning engineer. With the ability to streamline processes ranging from data preparation to model deployment and monitoring, it enables teams to efficiently convert raw data into actionable insights. What is MLOps?
GPTs for Data science are the next step towards innovation in various data-related tasks. These are platforms that integrate the field of data analytics with artificial intelligence (AI) and machinelearning (ML) solutions. However, our focus lies on exploring the GPTs for data science available on the platform.
In this blog, we will share the list of leading data science conferences across the world to be held in 2023. This will help you to learn and grow your career in data science, AI and machinelearning. Top data science conferences 2023 in different regions of the world 1.
The Power of Embeddings with Vector Search Embeddings are a powerful tool for representing data in an easy-to-understand way for machinelearning algorithms. Master ChatGPT for DataAnalysis and Visualization! What are some of the benefits of using the ChatGPT API to build AI applications?
These skills include programming languages such as Python and R, statistics and probability, machinelearning, datavisualization, and data modeling. Data preparation is an essential step in the data science workflow, and data scientists should be familiar with various data preparation tools and best practices.
Spline: This model uses polynomial functions fitted to segments of data, allowing smooth transitions and better representation of trends. Support vector machines (SVM) Support Vector Machines are a robust classification technique in machinelearning.
ArticleVideo Book Understand the ML best practice and project roadmap When a customer wants to implement ML(MachineLearning) for the identified business problem(s) after. The post Rapid-Fire EDA process using Python for ML Implementation appeared first on Analytics Vidhya.
Read a comprehensive SQL guide for dataanalysis; Learn how to choose the right clustering algorithm for your data; Find out how to create a viral DataViz using the data from Data Science Skills poll; Enroll in any of 10 Free Top Notch Natural Language Processing Courses; and more.
It’s like the detective’s toolkit, providing the tools to analyze and interpret data. Think of it as the ability to read between the lines of the data and uncover hidden patterns. DataAnalysis and Interpretation: Data scientists use statistics to understand what the data is telling them.
t-SNE (t-distributed stochastic neighbor embedding) has become an essential tool in the realm of data analytics, standing out for its ability to unravel the complexities inherent in high-dimensional data. Advantages of t-SNE t-SNE offers several key benefits that make it a preferred choice for certain dataanalysis tasks.
Here are some key ways data scientists are leveraging AI tools and technologies: 6 Ways Data Scientists are Leveraging Large Language Models with Examples Advanced MachineLearning Algorithms: Data scientists are utilizing more advanced machinelearning algorithms to derive valuable insights from complex and large datasets.
One of the main reasons for its popularity is the vast array of libraries and packages available for data manipulation, analysis, and visualization. It supports large, multi-dimensional arrays and matrices of numerical data, as well as a large library of mathematical functions to operate on these arrays.
Machinelearning engineer vs data scientist: two distinct roles with overlapping expertise, each essential in unlocking the power of data-driven insights. As businesses strive to stay competitive and make data-driven decisions, the roles of machinelearning engineers and data scientists have gained prominence.
Python machinelearning packages have emerged as the go-to choice for implementing and working with machinelearning algorithms. These libraries, with their rich functionalities and comprehensive toolsets, have become the backbone of data science and machinelearning practices.
Data Science is a field that encompasses various disciplines, including statistics, machinelearning, and dataanalysis techniques to extract valuable insights and knowledge from data. It is divided into three primary areas: data preparation, data modeling, and datavisualization.
Datavisualizations: Datavisualization is the art and science of representing complex data in a visual and comprehensible form. Time series analysis involves techniques for datavisualization, smoothing, forecasting, and modeling to uncover insights and make predictions about future values.
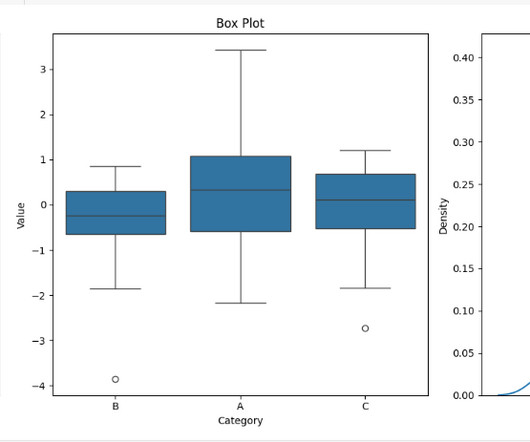
Introduction This article explores violin plots, a powerful visualization tool that combines box plots with density plots. It explains how these plots can reveal patterns in data, making them useful for data scientists and machinelearning practitioners.
Summary: DataAnalysis focuses on extracting meaningful insights from raw data using statistical and analytical methods, while datavisualization transforms these insights into visual formats like graphs and charts for better comprehension. Is DataAnalysis just about crunching numbers?
Introduction Python is a versatile and powerful programming language that plays a central role in the toolkit of data scientists and analysts. Its simplicity and readability make it a preferred choice for working with data, from the most fundamental tasks to cutting-edge artificial intelligence and machinelearning.
Last Updated on June 27, 2023 by Editorial Team Source: Unsplash This piece dives into the top machinelearning developer tools being used by developers — start building! In the rapidly expanding field of artificial intelligence (AI), machinelearning tools play an instrumental role.
Table of Contents Introduction Working with dataset Creating loss dataframe VisualizationsAnalysis from Heatmap Overall Analysis Conclusion Introduction In this article, I am going to perform Exploratory DataAnalysis on the Sample Superstore dataset.
We organize all of the trending information in your field so you don't have to. Join 17,000+ users and stay up to date on the latest articles your peers are reading.
You know about us, now we want to get to know you!
Let's personalize your content
Let's get even more personalized
We recognize your account from another site in our network, please click 'Send Email' below to continue with verifying your account and setting a password.


Let's personalize your content