This site uses cookies to improve your experience. To help us insure we adhere to various privacy regulations, please select your country/region of residence. If you do not select a country, we will assume you are from the United States. Select your Cookie Settings or view our Privacy Policy and Terms of Use.
Cookie Settings
Cookies and similar technologies are used on this website for proper function of the website, for tracking performance analytics and for marketing purposes. We and some of our third-party providers may use cookie data for various purposes. Please review the cookie settings below and choose your preference.
Used for the proper function of the website
Used for monitoring website traffic and interactions
Cookie Settings
Cookies and similar technologies are used on this website for proper function of the website, for tracking performance analytics and for marketing purposes. We and some of our third-party providers may use cookie data for various purposes. Please review the cookie settings below and choose your preference.
Strictly Necessary: Used for the proper function of the website
Performance/Analytics: Used for monitoring website traffic and interactions
Introduction While Tableau remains a popular choice for datavisualization, its dominance is waning. The increasing importance of dataanalysis across industries has fueled the demand for versatile tools, leading to a surge in Tableau alternatives.
Introduction Tableau is a powerful datavisualization tool that is crucial in Data Science. Its significance lies in its ability to transform complex data into easily understandable visualizations, aiding in better decision-making processes.
That’s why businesses of all types and sizes are embracing datavisualization, albeit often with a simplified approach. Power BI and Tableau, popular and user-friendly datavisualization tools, help businesses organize large datasets.
Introduction Tableau is considered one of the most robust datavisualization tools currently in use by companies and individuals globally for efficient dataanalysis and presentation.
Datavisualization is the art of presenting complex information in a way that is easy to understand and analyze. With the explosion of data in today’s business world, the ability to create compelling datavisualizations has become a critical skill for anyone working with data.
To address this challenge, businesses need to use advanced dataanalysis methods. These methods can help businesses to make sense of their data and to identify trends and patterns that would otherwise be invisible. In recent years, there has been a growing interest in the use of artificial intelligence (AI) for dataanalysis.
Summary: Big Datavisualization involves representing large datasets graphically to reveal patterns, trends, and insights that are not easily discernible from raw data. quintillion bytes of data daily, the need for effective visualization techniques has never been greater. As we generate approximately 2.5
For instance, Berkeley’s Division of Data Science and Information points out that entry level data science jobs remote in healthcare involves skills in NLP (Natural Language Processing) for patient and genomic dataanalysis, whereas remote data science jobs in finance leans more on skills in risk modeling and quantitative analysis.
Summary : Prepare for your datavisualization interview with our guide to the top questions and answers. Introduction Datavisualization is no longer just a niche skill; it’s a fundamental component of DataAnalysis , business intelligence, and data science.
It’s one of our guiding principles at Tableau and why we support students and instructors around the globe through Tableau Academic Programs. Our mission is to lower the barrier of entry to learning analytics and build data literacy skills in future generations. . Data skills are also interdisciplinary.
Libraries and Tools: Libraries like Pandas, NumPy, Scikit-learn, Matplotlib, Seaborn, and Tableau are like specialized tools for dataanalysis, visualization, and machine learning. Data Cleaning and Preprocessing Before analyzing data, it often needs a cleanup. It’s like deciphering a secret code.
Colten Woo November 15, 2023 - 5:12pm Daniel Platt Senior Product Manager, Tableau The quest for timely, accurate, and actionable insights is perennial in the ever-evolving data analytics landscape. Business users and data analysts alike grapple with the challenge of translating vast swathes of data into meaningful narratives.
Technical Fellow, Tableau. Innovation is necessary to use data effectively in the pursuit of a better world, particularly because data continues to increase in size and richness. I am proud to announce that my History of Tableau Innovation viz is now published to Tableau Public. Jock Mackinlay. Bronwen Boyd.
From data collection to dataanalysis and presentation, this blog will cover it all. SPSS – SPSS is a statistical software package used for dataanalysis, data mining, and forecasting. Excel – Excel is spreadsheet software used for organizing, analyzing, and presenting data.
Tableau Academic Programs Instructional Designer. Bridge the data literacy gap for students in academia. Working with data is a necessity for most jobs, and analytical skills can be a huge differentiator for success across all kinds of work—whether corporate, nonprofit, or academic. Learning how to communicate with data .
Product Manager, Tableau. Tableau Public provides a place for the global data community to develop data skills and, in turn, foster Data Culture. More than 2 million authors use the free platform to explore, create, and publicly share datavisualizations—and grow their portfolios. Alex Novelli.
Product Manager, Tableau. Tableau Public provides a place for the global data community to develop data skills and, in turn, foster Data Culture. More than 2 million authors use the free platform to explore, create, and publicly share datavisualizations—and grow their portfolios. Alex Novelli.
It’s one of our guiding principles at Tableau and why we support students and instructors around the globe through Tableau Academic Programs. Our mission is to lower the barrier of entry to learning analytics and build data literacy skills in future generations. Data skills are also interdisciplinary.
It’s like the detective’s toolkit, providing the tools to analyze and interpret data. Think of it as the ability to read between the lines of the data and uncover hidden patterns. DataAnalysis and Interpretation: Data scientists use statistics to understand what the data is telling them.
Summary: DataAnalysis focuses on extracting meaningful insights from raw data using statistical and analytical methods, while datavisualization transforms these insights into visual formats like graphs and charts for better comprehension. Is DataAnalysis just about crunching numbers?
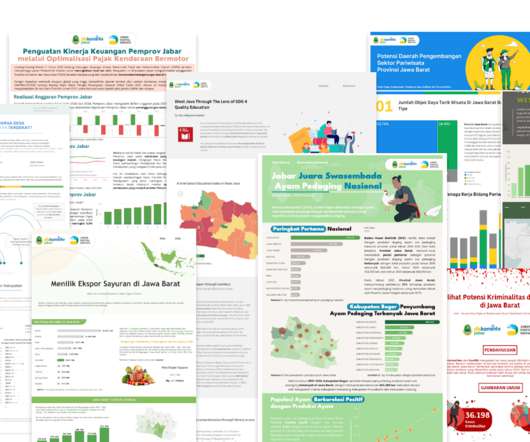
Gandes Goldestan Business Intelligence Analyst Jabar Digital Service Sarah Molina January 24, 2023 - 8:29pm January 25, 2023 Tableau plays a huge role in helping users get to insights quickly while telling impactful stories using their data. All visualizations were published on Tableau Public.
Companies use Business Intelligence (BI), Data Science , and Process Mining to leverage data for better decision-making, improve operational efficiency, and gain a competitive edge. A Data Product can take various forms, depending on the domain’s requirements and the data it manages.
The good news is that you don’t need to be an engineer, scientist, or programmer to acquire the necessary dataanalysis skills. Whether you’re located anywhere in the world or belong to any profession, you can still develop the expertise needed to be a skilled data analyst. Who are data analysts?
Technical Fellow, Tableau. Innovation is necessary to use data effectively in the pursuit of a better world, particularly because data continues to increase in size and richness. I am proud to announce that my History of Tableau Innovation viz is now published to Tableau Public. Jock Mackinlay. Bronwen Boyd.
Gandes Goldestan Business Intelligence Analyst Jabar Digital Service Sarah Molina January 24, 2023 - 8:29pm January 25, 2023 Tableau plays a huge role in helping users get to insights quickly while telling impactful stories using their data. All visualizations were published on Tableau Public.
Kuber Sharma Director, Product Marketing, Tableau Kristin Adderson August 22, 2023 - 12:11am August 22, 2023 Whether you're a novice data analyst exploring the possibilities of Tableau or a leader with years of experience using VizQL to gain advanced insights—this is your list of key Tableau features you should know, from A to Z.
Senior Technical Evangelist, Tableau at Salesforce. Tableau’s superpower is the ability to quickly turn data from a dry, obtuse data source into a rich, impactful data story. What, then, if you took it to the next level and asked Tableau experts to do this at speed, in front of their peers and a panel of judges?
Senior Technical Evangelist, Tableau at Salesforce. Tableau’s superpower is the ability to quickly turn data from a dry, obtuse data source into a rich, impactful data story. What, then, if you took it to the next level and asked Tableau experts to do this at speed, in front of their peers and a panel of judges?
Open source business intelligence software is a game-changer in the world of dataanalysis and decision-making. It has revolutionized the way businesses approach data analytics by providing cost-effective and customizable solutions that are tailored to specific business needs.
Summary: Datavisualization is the art of transforming complex data sets into easily understandable visuals like charts, graphs, and maps. By presenting information visually, datavisualization allows us to communicate insights clearly and effectively to a wider audience.
A data science book: Consider gifting a popular and highly recommended book on data science, such as "Python for DataAnalysis" by Wes McKinney or "The Elements of Statistical Learning" by Trevor Hastie, Robert Tibshirani, and Jerome Friedman.
There are many well-known libraries and platforms for dataanalysis such as Pandas and Tableau, in addition to analytical databases like ClickHouse, MariaDB, Apache Druid, Apache Pinot, Google BigQuery, Amazon RedShift, etc. Datavisualization can help here by visualizing your datasets.
Augmented analytics is revolutionizing how organizations interact with their data. By harnessing the power of machine learning (ML) and natural language processing (NLP), businesses can streamline their dataanalysis processes and make more informed decisions.
Tableau is a data visualisation software helping you to generate graphics-rich reporting and analysing enormous volumes of data. With the help of Tableau, organisations have been able to mine and gather actionable insights from granular sources of data. Let’s read the blog to find out!
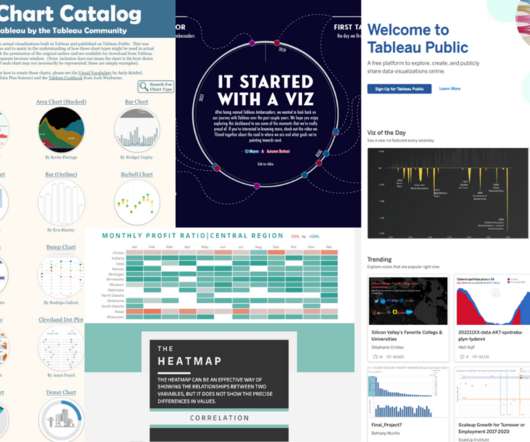
Director, Tableau Public. Collage of Tableau Public visualizations ( The Tableau Chart Catalog by Kevin Flerlage, The Tableau Chart Builder by Jeff Plattner, and It Started With A Viz | VOTD by Autumn Battani) and the Tableau Public homepage. Fred Najjar, Tableau Public Ambassador. Taha Ebrahimi.
Director, Tableau Public. Collage of Tableau Public visualizations ( The Tableau Chart Catalog by Kevin Flerlage, The Tableau Chart Builder by Jeff Plattner, and It Started With A Viz | VOTD by Autumn Battani) and the Tableau Public homepage. Fred Najjar, Tableau Public Ambassador. Taha Ebrahimi.
Two tools that have significantly impacted the data analytics landscape are KNIME and Tableau. KNIME Analytics Platform is an open-source data analytics tool that enables users to manage, process, and analyze data through a visual, user-friendly interface. You can read more about the KNIME Tableau Integration here.
Summary: Struggling to translate data into clear stories? Tableau can help! This datavisualization tool empowers Data Analysts with drag-and-drop simplicity, interactive dashboards, and a wide range of visualizations. What are The Benefits of Learning Tableau for Data Analysts?
Summary: Data Blending in Tableau is helpful in deriving multiple sources to gain comprehensive insights. It allows analysts to merge datasets seamlessly, leveraging common fields or dimensions for correlation analysis. Understanding the nuances of Data Blending in Tableau is crucial for extracting meaningful insights.
In the world of datavisualization , the ability to produce material that can speak to your audience, regardless of their technical expertise, is an ever-important factor to consider. Tableau Public Tableau Public , a powerful datavisualization software, empowers users to create interactive and shareable dashboards with ease.
Technical Evangelist Director, Tableau. As always with Iron Viz, I get the most joy from the small but important design flourishes, the little tweaks that advance the data storytelling, and the sometimes-hidden steps that elevate the dataanalysis. His submission was bananas in terms of custom charts and Tableau hacking.
Tableau Academic Programs Instructional Designer. Bridge the data literacy gap for students in academia. Working with data is a necessity for most jobs, and analytical skills can be a huge differentiator for success across all kinds of work—whether corporate, nonprofit, or academic. Learning how to communicate with data .
This includes duplicate removal, missing value treatment, variable transformation, and normalization of data. Tools like Python (with pandas and NumPy), R, and ETL platforms like Apache NiFi or Talend are used for data preparation before analysis.
We organize all of the trending information in your field so you don't have to. Join 17,000+ users and stay up to date on the latest articles your peers are reading.
You know about us, now we want to get to know you!
Let's personalize your content
Let's get even more personalized
We recognize your account from another site in our network, please click 'Send Email' below to continue with verifying your account and setting a password.


Let's personalize your content