This site uses cookies to improve your experience. To help us insure we adhere to various privacy regulations, please select your country/region of residence. If you do not select a country, we will assume you are from the United States. Select your Cookie Settings or view our Privacy Policy and Terms of Use.
Cookie Settings
Cookies and similar technologies are used on this website for proper function of the website, for tracking performance analytics and for marketing purposes. We and some of our third-party providers may use cookie data for various purposes. Please review the cookie settings below and choose your preference.
Used for the proper function of the website
Used for monitoring website traffic and interactions
Cookie Settings
Cookies and similar technologies are used on this website for proper function of the website, for tracking performance analytics and for marketing purposes. We and some of our third-party providers may use cookie data for various purposes. Please review the cookie settings below and choose your preference.
Strictly Necessary: Used for the proper function of the website
Performance/Analytics: Used for monitoring website traffic and interactions
By utilizing algorithms and statistical models, data mining transforms raw data into actionable insights. The data mining process The data mining process is structured into four primary stages: data gathering, data preparation, data mining, and dataanalysis and interpretation.
Synthetic data refers to artificially generated data that mirrors the statistical patterns and structures of real datasets without disclosing sensitive information about individuals. Importance of synthetic data The significance of synthetic data lies in its ability to address critical challenges in data handling and analysis.
Unsupervised models Unsupervised models typically use traditional statistical methods such as logistic regression, time series analysis, and decisiontrees. These methods analyze data without pre-labeled outcomes, focusing on discovering patterns and relationships.
You're not ready for neural networks if you cant explain Linear Regression or DecisionTrees. Lets get started. Forget deep learning for now. Its crucial to start with small, simple models. These simple models work wonders for small datasets and lay a solid foundation for understanding the basics.
Libraries and Tools: Libraries like Pandas, NumPy, Scikit-learn, Matplotlib, Seaborn, and Tableau are like specialized tools for dataanalysis, visualization, and machine learning. Data Cleaning and Preprocessing Before analyzing data, it often needs a cleanup. This is like dusting off the clues before examining them.
You're not ready for neural networks if you cant explain Linear Regression or DecisionTrees. Lets get started. Forget deep learning for now. Its crucial to start with small, simple models. These simple models work wonders for small datasets and lay a solid foundation for understanding the basics.
Zheng’s “Guide to Data Structures and Algorithms” Parts 1 and Part 2 1) Big O Notation 2) Search 3) Sort 3)–i)–Quicksort 3)–ii–Mergesort 4) Stack 5) Queue 6) Array 7) Hash Table 8) Graph 9) Tree (e.g.,
In the world of Machine Learning and DataAnalysis , decisiontrees have emerged as powerful tools for making complex decisions and predictions. These tree-like structures break down a problem into smaller, manageable parts, enabling us to make informed choices based on data. What is a DecisionTree?
This post will delve into one of the many facets of KNIME’s capabilities –building predictive models using decisiontrees and random forests. These algorithms are not just fundamental to any data scientist’s toolkit, but they also form the backbone of many complex machine learning workflows.
It’s like the detective’s toolkit, providing the tools to analyze and interpret data. Think of it as the ability to read between the lines of the data and uncover hidden patterns. DataAnalysis and Interpretation: Data scientists use statistics to understand what the data is telling them.
It provides a fast and efficient way to manipulate data arrays. Pandas is a library for dataanalysis. It provides a high-level interface for working with data frames. Matplotlib is a library for plotting data. Decisiontrees are used to classify data into different categories.
Exploratory DataAnalysis(EDA)on Biological Data: A Hands-On Guide Unraveling the Structural Data of Proteins, Part II — Exploratory DataAnalysis Photo from Pexels In a previous post, I covered the background of this protein structure resolution data set, including an explanation of key data terminology and details on how to acquire the data.
Summary: DataAnalysis focuses on extracting meaningful insights from raw data using statistical and analytical methods, while data visualization transforms these insights into visual formats like graphs and charts for better comprehension. Is DataAnalysis just about crunching numbers?
Summary: The Data Science and DataAnalysis life cycles are systematic processes crucial for uncovering insights from raw data. From acquisition to interpretation, these cycles guide decision-making, drive innovation, and enhance operational efficiency. billion INR by 2026, with a CAGR of 27.7%.
The course covers topics such as linear regression, logistic regression, and decisiontrees. Take the first step by enrolling in our comprehensive data science course. Gain expertise in dataanalysis, deep learning, neural networks, and more. Step up your game and make accurate predictions based on vast datasets.
From predicting patient outcomes to optimizing inventory management, these techniques empower decision-makers to navigate data landscapes confidently, fostering informed and strategic decision-making. It is a mathematical framework that aims to capture the underlying patterns, trends, and structures present in the data.
decisiontrees, support vector regression) that can model even more intricate relationships between features and the target variable. Support Vector Machines (SVM): This algorithm finds a hyperplane that best separates data points of different classes in high-dimensional space.
This discipline takes raw data, deciphers it, and turns it into a digestible format using various tools and algorithms. Tools such as Python, R, and SQL help to manipulate and analyze data. Demand in AI, machine learning, and dataanalysis is soaring, with implications for both fields.
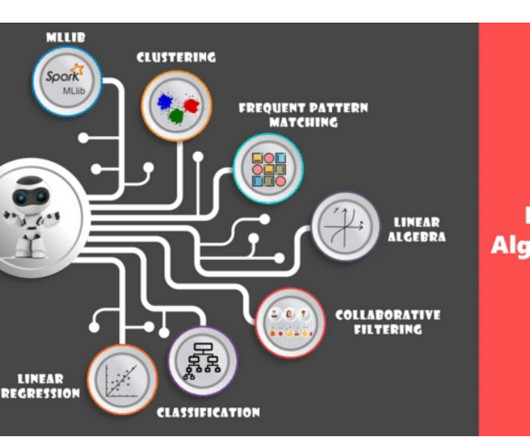
Pyspark MLlib is a wrapper over PySpark Core to do dataanalysis using machine-learning algorithms. So Let's use the DecisionTree to improve the performance. using PySpark we can run applications parallelly on the distributed cluster… blog.devgenius.io Spark MLlib is a short form of spark machine-learning library.
Unlock the Secrets of Data Science and Launch Your Lucrative Career with DataHour – Explore the Upcoming Sessions Now! DataHour is a program of informative and interesting webinars designed to assist people in starting lucrative careers in the data-tech industry.
You're not ready for neural networks if you cant explain Linear Regression or DecisionTrees. Lets get started. Forget deep learning for now. Its crucial to start with small, simple models. These simple models work wonders for small datasets and lay a solid foundation for understanding the basics.
In this era of information overload, utilizing the power of data and technology has become paramount to drive effective decision-making. Decision intelligence is an innovative approach that blends the realms of dataanalysis, artificial intelligence, and human judgment to empower businesses with actionable insights.
Introduction Are you struggling to decide between data-driven practices and AI-driven strategies for your business? Besides, there is a balance between the precision of traditional dataanalysis and the innovative potential of explainable artificial intelligence.
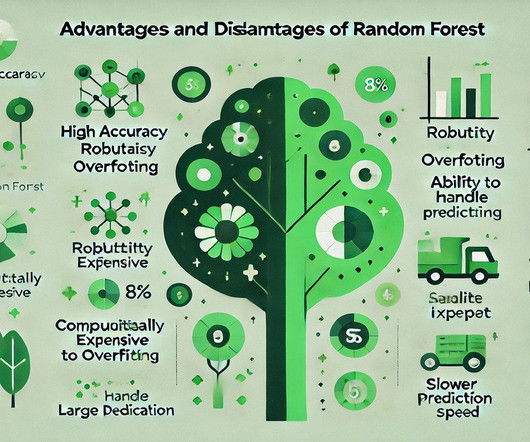
It builds multiple decisiontrees and merges them to produce accurate and stable predictions, making it a popular choice for complex data problems. Understanding these pros and cons will help you decide when to effectively utilise Random Forest in your DataAnalysis projects. What is Random Forest?
Data Science Project — Predictive Modeling on Biological Data Part III — A step-by-step guide on how to design a ML modeling pipeline with scikit-learn Functions. Photo by Unsplash Earlier we saw how to collect the data and how to perform exploratory dataanalysis. You can refer part-I and part-II of this article.
A sector that is currently being influenced by machine learning is the geospatial sector, through well-crafted algorithms that improve dataanalysis through mapping techniques such as image classification, object detection, spatial clustering, and predictive modeling, revolutionizing how we understand and interact with geographic information.
These tools enable dataanalysis, model building, and algorithm optimization, forming the backbone of ML applications. Feed data into an algorithm, and out comes predictions, classifications, or insights that seem almost intuitive. Introduction Machine Learning (ML) often seems like magic.
Here are some ways AI enhances IoT devices: Advanced dataanalysis AI algorithms can process and analyze vast volumes of IoT-generated data. By leveraging techniques like machine learning and deep learning, IoT devices can identify trends, anomalies, and patterns within the data.
Naïve Bayes algorithms include decisiontrees , which can actually accommodate both regression and classification algorithms. Random forest algorithms —predict a value or category by combining the results from a number of decisiontrees.
K-Nearest Neighbours (kNN) In order to calculate the distance between one data point and every other accomplished parameter through using the metrics of distance like Euclidean distance, Manhattan distance and others. DecisionTreesDecisionTrees are non-linear model unlike the logistic regression which is a linear model.
Summary: Statistical Modeling is essential for DataAnalysis, helping organisations predict outcomes and understand relationships between variables. It encompasses various models and techniques, applicable across industries like finance and healthcare, to drive informed decision-making.
Automated quotation generation using AI algorithms AI algorithms, such as rule-based systems, decisiontrees, and optimization algorithms, can automate the process of generating quotations based on predefined rules and pricing models.
Top 50+ Interview Questions for Data Analysts Technical Questions SQL Queries What is SQL, and why is it necessary for dataanalysis? SQL stands for Structured Query Language, essential for querying and manipulating data stored in relational databases. What are the advantages and disadvantages of decisiontrees ?
Big DataAnalysis with PySpark Bharti Motwani | Associate Professor | University of Maryland, USA Ideal for business analysts, this session will provide practical examples of how to use PySpark to solve business problems. Finally, you’ll discuss a stack that offers an improved UX that frees up time for tasks that matter.
Businesses must understand how to implement AI in their analysis to reap the full benefits of this technology. In the following sections, we will explore how AI shapes the world of financial dataanalysis and address potential challenges and solutions.
How could machine learning be used in network traffic analysis? Machine learning is fundamentally changing the landscape of network traffic analysis by automating the process of dataanalysis and interpretation.
Scikit-learn: A simple and efficient tool for data mining and dataanalysis, particularly for building and evaluating machine learning models. Data Normalization and Standardization: Scaling numerical data to a standard range to ensure fairness in model training.
Using comprehensive, AI-driven SaaS analytics, businesses can make data-driven decisions about feature enhancements, UI/UX improvements and marketing strategies to maximize user engagement and meet—or exceed—business goals. They may also struggle to fully leverage the predictive capabilities of app analytics.
ML focuses on enabling computers to learn from data and improve performance over time without explicit programming. Key Components In Data Science, key components include data cleaning, Exploratory DataAnalysis, and model building using statistical techniques. billion in 2022 to a remarkable USD 484.17
Significantly, Supervised Learning is practical in two types of tasks- Classification: the goal is to predict a categorical label for each input data point Regression: the goal is to predict a continuous value. It includes various algorithms like linear regression, logistic regression, decisiontrees, bayesian logic, etc.
Without this library, dataanalysis wouldn’t be the same without pandas, which reign supreme with its powerful data structures and manipulation tools. Pandas provides a fast and efficient way to work with tabular data. It is widely used in data science, finance, and other fields where dataanalysis is essential.
Data Cleaning: Raw data often contains errors, inconsistencies, and missing values. Data cleaning identifies and addresses these issues to ensure data quality and integrity. Data Visualisation: Effective communication of insights is crucial in Data Science.
In today’s data-driven world, industries across the board are turning to advanced tools and technologies to gain deeper insights and improve their decision-making processes. This is particularly true in the financial services sector, where accurate, real-time dataanalysis can be the key to success.
Augmented Analytics Augmented analytics is revolutionising the way businesses analyse data by integrating Artificial Intelligence (AI) and Machine Learning (ML) into analytics processes. Understand data structures and explore data warehousing concepts to efficiently manage and retrieve large datasets.
We organize all of the trending information in your field so you don't have to. Join 17,000+ users and stay up to date on the latest articles your peers are reading.
You know about us, now we want to get to know you!
Let's personalize your content
Let's get even more personalized
We recognize your account from another site in our network, please click 'Send Email' below to continue with verifying your account and setting a password.


Let's personalize your content