This site uses cookies to improve your experience. To help us insure we adhere to various privacy regulations, please select your country/region of residence. If you do not select a country, we will assume you are from the United States. Select your Cookie Settings or view our Privacy Policy and Terms of Use.
Cookie Settings
Cookies and similar technologies are used on this website for proper function of the website, for tracking performance analytics and for marketing purposes. We and some of our third-party providers may use cookie data for various purposes. Please review the cookie settings below and choose your preference.
Used for the proper function of the website
Used for monitoring website traffic and interactions
Cookie Settings
Cookies and similar technologies are used on this website for proper function of the website, for tracking performance analytics and for marketing purposes. We and some of our third-party providers may use cookie data for various purposes. Please review the cookie settings below and choose your preference.
Strictly Necessary: Used for the proper function of the website
Performance/Analytics: Used for monitoring website traffic and interactions
I have been in the Data field for over 8 years, and Machine Learning is what got me interested then, so I am writing about this! They chase the hype Neural Networks, Transformers, DeepLearning, and, who can forget AI and fall flat. Youll learn faster than any tutorial can teach you. More about me here.
I have been in the Data field for over 8 years, and Machine Learning is what got me interested then, so I am writing about this! They chase the hype Neural Networks, Transformers, DeepLearning, and, who can forget AI and fall flat. Youll learn faster than any tutorial can teach you. More about me here.
Synthetic data refers to artificially generated data that mirrors the statistical patterns and structures of real datasets without disclosing sensitive information about individuals. Importance of synthetic data The significance of synthetic data lies in its ability to address critical challenges in data handling and analysis.
By utilizing algorithms and statistical models, data mining transforms raw data into actionable insights. The data mining process The data mining process is structured into four primary stages: data gathering, data preparation, data mining, and dataanalysis and interpretation.
Machine Learning with TensorFlow by Google AI This is a beginner-level course that teaches you the basics of machine learning using TensorFlow , a popular machine-learning library. The course covers topics such as linear regression, logistic regression, and decisiontrees.
I have been in the Data field for over 8 years, and Machine Learning is what got me interested then, so I am writing about this! They chase the hype Neural Networks, Transformers, DeepLearning, and, who can forget AI and fall flat. Youll learn faster than any tutorial can teach you. More about me here.
Summary: Machine Learning and DeepLearning are AI subsets with distinct applications. ML works with structured data, while DL processes complex, unstructured data. Introduction In todays world of AI, both Machine Learning (ML) and DeepLearning (DL) are transforming industries, yet many confuse the two.
decisiontrees, support vector regression) that can model even more intricate relationships between features and the target variable. Support Vector Machines (SVM): This algorithm finds a hyperplane that best separates data points of different classes in high-dimensional space.
Here are some ways AI enhances IoT devices: Advanced dataanalysis AI algorithms can process and analyze vast volumes of IoT-generated data. By leveraging techniques like machine learning and deeplearning, IoT devices can identify trends, anomalies, and patterns within the data.
A sector that is currently being influenced by machine learning is the geospatial sector, through well-crafted algorithms that improve dataanalysis through mapping techniques such as image classification, object detection, spatial clustering, and predictive modeling, revolutionizing how we understand and interact with geographic information.
They’re also part of a family of generative learning algorithms that model the input distribution of a given class or/category. Naïve Bayes algorithms include decisiontrees , which can actually accommodate both regression and classification algorithms.
The reasoning behind that is simple; whatever we have learned till now, be it adaptive boosting, decisiontrees, or gradient boosting, have very distinct statistical foundations which require you to get your hands dirty with the math behind them. The goal is to nullify the abstraction created by packages as much as possible.
Data Science Project — Predictive Modeling on Biological Data Part III — A step-by-step guide on how to design a ML modeling pipeline with scikit-learn Functions. Photo by Unsplash Earlier we saw how to collect the data and how to perform exploratory dataanalysis. Now comes the exciting part ….
Summary: This guide explores Artificial Intelligence Using Python, from essential libraries like NumPy and Pandas to advanced techniques in machine learning and deeplearning. Scikit-learn: A simple and efficient tool for data mining and dataanalysis, particularly for building and evaluating machine learning models.
You’ll explore the current production-grade tools, techniques, and workflows as well as explore the 8 layers of the machine learning stack. You’ll get hands-on practice with unsupervised learning techniques, such as K-Means clustering, and classification algorithms like decisiontrees and random forest.
Without this library, dataanalysis wouldn’t be the same without pandas, which reign supreme with its powerful data structures and manipulation tools. Pandas provides a fast and efficient way to work with tabular data. It is widely used in data science, finance, and other fields where dataanalysis is essential.
Businesses must understand how to implement AI in their analysis to reap the full benefits of this technology. In the following sections, we will explore how AI shapes the world of financial dataanalysis and address potential challenges and solutions.
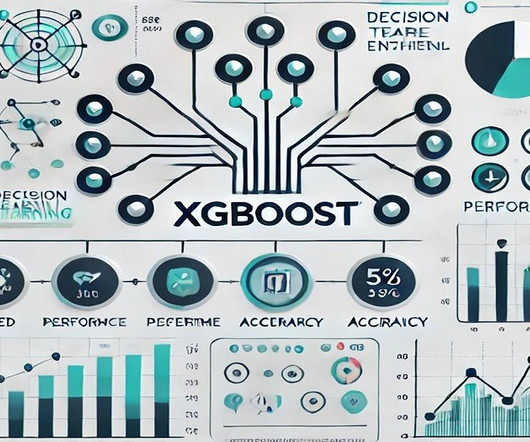
Setting Up the Prerequisites Building the Model Assessing the Model Summary Citation Information Scaling Kaggle Competitions Using XGBoost: Part 2 In our previous tutorial , we went through the basic foundation behind XGBoost and learned how easy it was to incorporate a basic XGBoost model into our project. Table 1: The Dataset.
How could machine learning be used in network traffic analysis? Machine learning is fundamentally changing the landscape of network traffic analysis by automating the process of dataanalysis and interpretation.
Top 50+ Interview Questions for Data Analysts Technical Questions SQL Queries What is SQL, and why is it necessary for dataanalysis? SQL stands for Structured Query Language, essential for querying and manipulating data stored in relational databases. What are the advantages and disadvantages of decisiontrees ?
Machine learning can then “learn” from the data to create insights that improve performance or inform predictions. Just as humans can learn through experience rather than merely following instructions, machines can learn by applying tools to dataanalysis.
A cheat sheet for Data Scientists is a concise reference guide, summarizing key concepts, formulas, and best practices in DataAnalysis, statistics, and Machine Learning. Here, we’ll explore why Data Science is indispensable in today’s world. Is Data Scientist math heavy?
The following Venn diagram depicts the difference between data science and data analytics clearly: 3. Dataanalysis can not be done on a whole volume of data at a time especially when it involves larger datasets. Overfitting: The model performs well only for the sample training data.
The main difference being that while KNN makes assumptions based on data points that are closest together, LOF uses the points that are furthest apart to draw its conclusions. Unsupervised learning Unsupervised learning techniques do not require labeled data and can handle more complex data sets.
Summary: The blog explores the synergy between Artificial Intelligence (AI) and Data Science, highlighting their complementary roles in DataAnalysis and intelligent decision-making. These components solve complex problems and drive decision-making in various industries.
Introduction Boosting is a powerful Machine Learning ensemble technique that combines multiple weak learners, typically decisiontrees, to form a strong predictive model. Lets explore the mathematical foundation, unique enhancements, and tree-pruning strategies that make XGBoost a standout algorithm. Lower values (e.g.,
Selecting an Algorithm Choosing the correct Machine Learning algorithm is vital to the success of your model. For example, linear regression is typically used to predict continuous variables, while decisiontrees are great for classification and regression tasks. Decisiontrees are easy to interpret but prone to overfitting.
Data Cleaning: Raw data often contains errors, inconsistencies, and missing values. Data cleaning identifies and addresses these issues to ensure data quality and integrity. Data Visualisation: Effective communication of insights is crucial in Data Science.
Some important things that were considered during these selections were: Random Forest : The ultimate feature importance in a Random forest is the average of all decisiontree feature importance. A random forest is an ensemble classifier that makes predictions using a variety of decisiontrees. link] Ganaie, M.
For example, in neural networks, data is represented as matrices, and operations like matrix multiplication transform inputs through layers, adjusting weights during training. Without linear algebra, understanding the mechanics of DeepLearning and optimisation would be nearly impossible.
It could be anything from customer service to dataanalysis. Collect data: Gather the necessary data that will be used to train the AI system. This data should be relevant, accurate, and comprehensive. Several algorithms are available, including decisiontrees, neural networks, and support vector machines.
Statistical Concepts A strong understanding of statistical concepts, including probability, hypothesis testing, regression analysis, and experimental design, is paramount in Data Science roles.
It is therefore important to carefully plan and execute data preparation tasks to ensure the best possible performance of the machine learning model. Batch size and learning rate are two important hyperparameters that can significantly affect the training of deeplearning models, including LLMs.
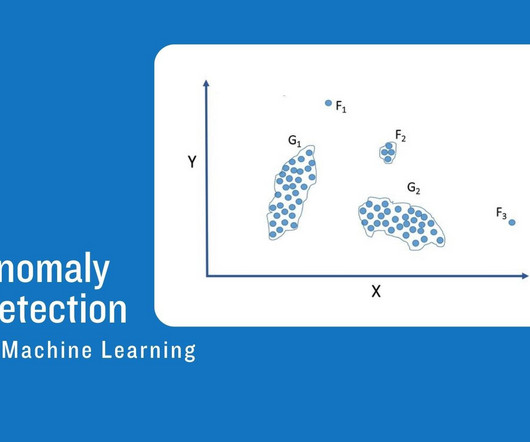
49% of companies in the world that use Machine Learning and AI in their marketing and sales processes apply it to identify the prospects of sales. An ensemble of decisiontrees is trained on both normal and anomalous data. Anomalies might lead to deviations from the normal patterns the model has learned.
Python packages such as Scikit-learn assist fundamental machine learning algorithms such as classification and regression, whereas Keras, Caffe, and TensorFlow enable deeplearning. R Source: i2tutorials Statisticians developed R as a tool for statistical computing. We pay our contributors, and we don’t sell ads.
Moving the machine learning models to production is tough, especially the larger deeplearning models as it involves a lot of processes starting from data ingestion to deployment and monitoring. It provides different features for building as well as deploying various deeplearning-based solutions.
In a typical MLOps project, similar scheduling is essential to handle new data and track model performance continuously. Load and Explore Data We load the Telco Customer Churn dataset and perform exploratory dataanalysis (EDA). Random Forest Classifier (rf): Ensemble method combining multiple decisiontrees.
Source: [link] Weights and Biases Weights and biases are the key components of the deeplearning architectures that affect the model performance. LIME can help improve model transparency, build trust, and ensure that models make fair and unbiased decisions by identifying the key features that are more relevant in prediction-making.
Tabular data is a foundational element in the realm of dataanalysis, serving as the backbone for a variety of machine learning applications. What is tabular data? Tabular data consists of structured information organized in rows and columns, resembling a spreadsheet layout.
The rise of neural networks in the 1980s marked a pivotal shift, driven by advancements in deeplearning techniques. Understanding the neural vs. symbolic paradigm Neural methods, like deeplearning, excel in pattern recognition and are adept at processing large datasets quickly.
We organize all of the trending information in your field so you don't have to. Join 17,000+ users and stay up to date on the latest articles your peers are reading.
You know about us, now we want to get to know you!
Let's personalize your content
Let's get even more personalized
We recognize your account from another site in our network, please click 'Send Email' below to continue with verifying your account and setting a password.


Let's personalize your content