This site uses cookies to improve your experience. To help us insure we adhere to various privacy regulations, please select your country/region of residence. If you do not select a country, we will assume you are from the United States. Select your Cookie Settings or view our Privacy Policy and Terms of Use.
Cookie Settings
Cookies and similar technologies are used on this website for proper function of the website, for tracking performance analytics and for marketing purposes. We and some of our third-party providers may use cookie data for various purposes. Please review the cookie settings below and choose your preference.
Used for the proper function of the website
Used for monitoring website traffic and interactions
Cookie Settings
Cookies and similar technologies are used on this website for proper function of the website, for tracking performance analytics and for marketing purposes. We and some of our third-party providers may use cookie data for various purposes. Please review the cookie settings below and choose your preference.
Strictly Necessary: Used for the proper function of the website
Performance/Analytics: Used for monitoring website traffic and interactions
Summary: Online Analytical Processing (OLAP) systems in Data Warehouse enable complex DataAnalysis by organizing information into multidimensional structures. Key characteristics include fast query performance, interactive analysis, hierarchical data organization, and support for multiple users.
In the process of working on their ML tasks, data scientists typically start their workflow by discovering relevant data sources and connecting to them. They then use SQL to explore, analyze, visualize, and integrate data from various sources before using it in their ML training and inference.
The SQL language, or Structured Query Language, is essential for managing and manipulating relational databases. It has become indispensable for those working with data across various industries. Introduction to SQL language SQL language stands for Structured Query Language. Why learn SQL language?
They have structured data such as sales transactions and revenue metrics stored in databases, alongside unstructured data such as customer reviews and marketing reports collected from various channels. Download all three sample data files. You’ll use this file when setting up your function to query sales data.
In the increasingly competitive world, understanding the data and taking quicker actions based on that help create differentiation for the organization to stay ahead! It is used to discover trends [2], patterns, relationships, and anomalies in data, and can help inform the development of more complex models [3].
SageMaker Unied Studio is an integrated development environment (IDE) for data, analytics, and AI. Discover your data and put it to work using familiar AWS tools to complete end-to-end development workflows, including dataanalysis, data processing, model training, generative AI app building, and more, in a single governed environment.
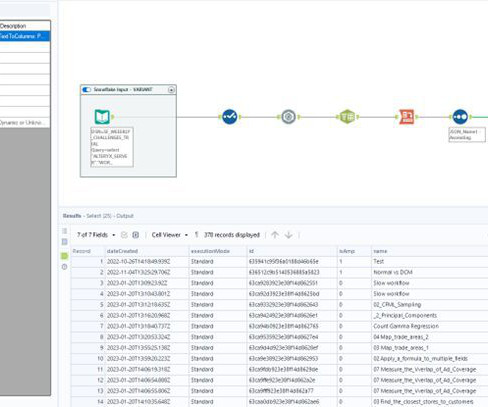
Alteryx provides powerful features, such as its JSON Parser, which can help analyze VARIANT data type fields from Snowflake. This versatile data type can store semi-structured data, allowing for flexibility in handling various data formats within a single column.
Users only need to include the respective path in the SQL query to get to work. In addition to supporting standard SQL, Apache Drill lets you keep depending on business intelligence tools you may already use, such as Qlik and Tableau. It allows secure and interactive SQL analytics at the petabyte scale.
They can generate code in Python, JavaScript, SQL, and call well-known APIs. It could be an SQL query, that is sent to the tool that the Agent knows will execute SQL queries. We will create an incredibly powerful Agent that allows us to perform dataanalysis actions on any Excel sheet we provide.
The format can be classified by size, but you can choose to organize data horizontally or vertically/by column. It doesn’t matter if you use graphs or charts, you need to get better at data visualization. The way in which you store data impacts ease of access, use, not to mention security. Speaking of which.
A well-organized portfolio demonstrates your ability to work with data and draw valuable insights. Here are the steps to build an impressive data analyst portfolio: Select Relevant Projects: Choose a variety of dataanalysis projects that highlight your skills and cover different aspects of dataanalysis.
Lyngo’s machine learning algorithms convert business questions into SQL, truly democratizing access to data and insights, giving users answers that previously only technical data analysts could provide. This lowers the barrier to entry to sophisticated dataanalysis for non-technical people.
It offers a collection of key commands and functions for efficient data manipulation using the Pandas library in Python. From reading data in various formats like CSV, Excel, and SQL to filtering, sorting, and aggregating data, this cheat sheet covers essential operations. Think of it as a spreadsheet or SQL table.
They are also designed to handle concurrent access by multiple users and applications, while ensuring data integrity and transactional consistency. Examples of OLTP databases include Oracle Database, Microsoft SQL Server, and MySQL. OLAP systems support business intelligence, data mining, and other decision support applications.
Each function provides a unique perspective on similarity, supporting diverse applications in dataanalysis and machine learning. How to Implement Text Splitting in Snowflake Using SQL and Python UDFs We will now demonstrate how to implement the types of Text Splitting we explained in the above section in Snowflake.
When you download KNIME Analytics Platform for the first time, you will no doubt notice the sheer number of nodes available to use in your workflows. This is where KNIME truly shines and sets itself apart from its competitors: the scores of free extensions available for download.
I find that R markdown is most useful for making reports or documents with your analysis. The most common ways to create a written report with dataanalysis notebooks are: 1. Python, R, SQL) code analysis in jupyter notebook, using Markdown notation — File —Download as (pdf, html, docx, etc) document 2.
These courses introduce you to Python, Statistics, and Machine Learning , all essential to Data Science. Starting with these basics enables a smoother transition to more specialised topics, such as Data Visualisation, Big DataAnalysis , and Artificial Intelligence. Data Science Course by Pickl.AI
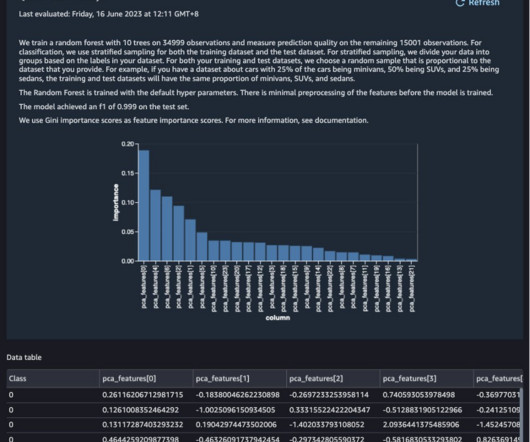
Optionally, if you’re using Snowflake OAuth access in SageMaker Data Wrangler, refer to Import data from Snowflake to set up an OAuth identity provider. Familiarity with Snowflake, basic SQL, the Snowsight UI, and Snowflake objects. We use this extracted dataset for exploratory dataanalysis and feature engineering.
introduces a wide range of capabilities designed to improve every stage of dataanalysis—from data preparation to dashboard consumption. With the enhancements to View Data, you can remove and add fields as well as adjust the number of rows to cover the breadth and depth that your analysis needs. Bronwen Boyd.
introduces a wide range of capabilities designed to improve every stage of dataanalysis—from data preparation to dashboard consumption. With the enhancements to View Data, you can remove and add fields as well as adjust the number of rows to cover the breadth and depth that your analysis needs. Bronwen Boyd.
It enables fast, efficient full-text search, real-time DataAnalysis , and scalable data retrieval across large datasets. Known for its speed and flexibility, Elasticsearch is widely used in applications where quick access to data is critical, such as e-commerce search, log analysis, and Business Intelligence.
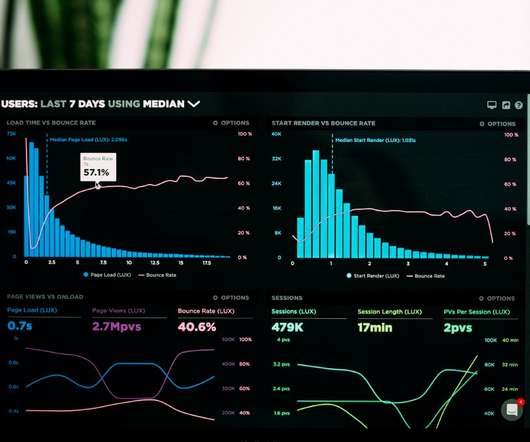
This process is essential for ensuring your visuals are populated with accurate, real-time data for meaningful insights. Installing Power BI Desktop Start by downloading and installing Power BI Desktop, the free version of Power BI. Its available for Windows and can be downloaded from the Microsoft website or the Microsoft Store.
hours of on-demand video 5 coding exercises 40 articles and 9 downloadable resources Full access on mobile and TV Data Science Job Guarantee Program by Pickl.AI This year-long program guarantees a job in Data Science , providing both conceptual knowledge and technical proficiency. Course Content: 42.5
This allows iterative dataanalysis workflows rather than rigid scripts. Python forms a common lingua franca for open data science thanks to its flexibility and the breadth of domain-specific packages continuously expanded by the active community. automatically produces visualizationsno SQL query or Python coding required.
I noticed that every product team depended on spreadsheets for last-mile analysis. But refreshing this analysis with the latest data was impossible… unless you were proficient in SQL or Python. Each analyst has their own version of analysis in their spreadsheets due to differences in formulas and data used.
Here’s the structured equivalent of this same data in tabular form: With structured data, you can use query languages like SQL to extract and interpret information. In contrast, such traditional query languages struggle to interpret unstructured data. This text has a lot of information, but it is not structured.
For outside use, a service such as Teamlogs also offers transcription, speaker separation, and in-browser text editing prior to download. User dataanalysis Chattermill is made for apps with tons of users, like BlaBlaCar and Uber. Meeting minutes from Neuroslav 3.
If youre not familiar with dplyr, imagine SQL, but more flexible andmodular. Writing R scripts to clean data or build charts wasnt easy for many. A New Way to Work WithData Its often said that 60% to 80% of the time spent on dataanalysis and reporting goes into data wrangling tasks like cleaning, transforming, and reshaping data.
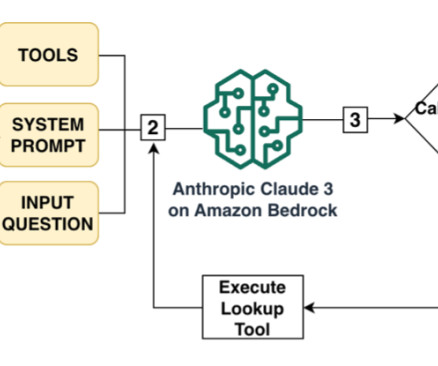
Large language models (LLMs) can help uncover insights from structured data such as a relational database management system (RDBMS) by generating complex SQL queries from natural language questions, making dataanalysis accessible to users of all skill levels and empowering organizations to make data-driven decisions faster than ever before.
We organize all of the trending information in your field so you don't have to. Join 17,000+ users and stay up to date on the latest articles your peers are reading.
You know about us, now we want to get to know you!
Let's personalize your content
Let's get even more personalized
We recognize your account from another site in our network, please click 'Send Email' below to continue with verifying your account and setting a password.


Let's personalize your content