This site uses cookies to improve your experience. To help us insure we adhere to various privacy regulations, please select your country/region of residence. If you do not select a country, we will assume you are from the United States. Select your Cookie Settings or view our Privacy Policy and Terms of Use.
Cookie Settings
Cookies and similar technologies are used on this website for proper function of the website, for tracking performance analytics and for marketing purposes. We and some of our third-party providers may use cookie data for various purposes. Please review the cookie settings below and choose your preference.
Used for the proper function of the website
Used for monitoring website traffic and interactions
Cookie Settings
Cookies and similar technologies are used on this website for proper function of the website, for tracking performance analytics and for marketing purposes. We and some of our third-party providers may use cookie data for various purposes. Please review the cookie settings below and choose your preference.
Strictly Necessary: Used for the proper function of the website
Performance/Analytics: Used for monitoring website traffic and interactions
Data Collection Once the problem is defined, the next step in the data workflow is collecting relevant data. In football analytics, this could mean pulling data from several sources, including event and player performance data. Tracking Data: Player movements and positioning.
The importance of EDA in the machine learning world is well known to its users. Making visualizations is one of the finest ways for data scientists to explain dataanalysis to people outside the business. Exploratory dataanalysis can help you comprehend your data better, which can aid in future data preprocessing.
Summary: DataAnalysis focuses on extracting meaningful insights from raw data using statistical and analytical methods, while data visualization transforms these insights into visual formats like graphs and charts for better comprehension. Is DataAnalysis just about crunching numbers?
Summary: This article explores different types of DataAnalysis, including descriptive, exploratory, inferential, predictive, diagnostic, and prescriptive analysis. Introduction DataAnalysis transforms raw data into valuable insights that drive informed decisions. What is DataAnalysis?
This article will guide you through effective strategies to learn Python for Data Science, covering essential resources, libraries, and practical applications to kickstart your journey in this thriving field. Key Takeaways Python’s simplicity makes it ideal for DataAnalysis. in 2022, according to the PYPL Index.
Exploratory DataAnalysis (EDA): We unpacked the importance of EDA, the process of uncovering patterns and relationships within your data. It learns from historical data to make predictions about future events. These models act like black boxes, taking inputs and producing outputs.
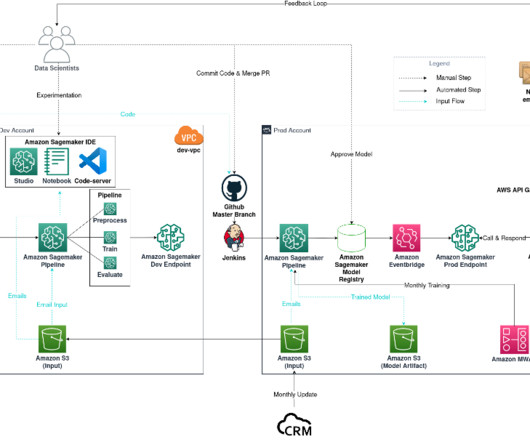
Email classification project diagram The workflow consists of the following components: Model experimentation – Data scientists use Amazon SageMaker Studio to carry out the first steps in the data science lifecycle: exploratory dataanalysis (EDA), data cleaning and preparation, and building prototype models.
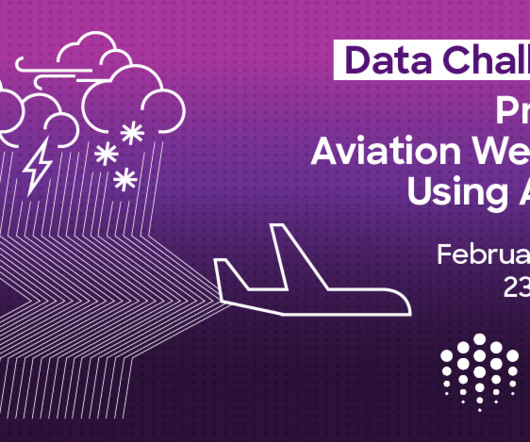
METAR, Miami International Airport (KMIA) on March 9, 2024, at 15:00 UTC In the recently concluded data challenge hosted on Desights.ai , participants used exploratory dataanalysis (EDA) and advanced artificial intelligence (AI) techniques to enhance aviation weather forecasting accuracy.
Comet is an MLOps platform that offers a suite of tools for machine-learning experimentation and dataanalysis. It is designed to make it easy to track and monitor experiments and conduct exploratory dataanalysis (EDA) using popular Python visualization frameworks. What is Comet?
We will carry out some EDA on our dataset, and then we will log the visualizations onto the Comet experimentation website or platform. Time Series Models Time series models are a type of statistical model that are used to analyze and make predictions about data that is collected over time. Without further ado, let’s begin.
A model builder: Data scientists create models that simulate real-world processes. These models can predict future events, classify data into categories, or uncover relationships between variables, enabling better decision-making.
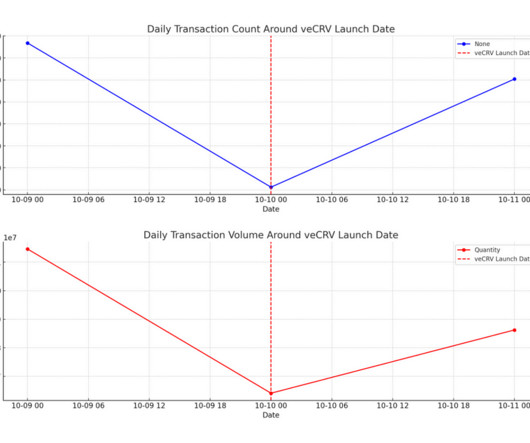
Abstract This research report encapsulates the findings from the Curve Finance Data Challenge , a competition that engaged 34 participants in a comprehensive analysis of the decentralized finance protocol. Part 1: Exploratory DataAnalysis (EDA) MEV Over 25,000 MEV-related transactions have been executed through Curve.
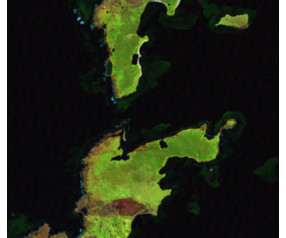
We take a gap year to participate in AI competitions and projects, and organize and attend events. At the time of selecting competitions, this was the most attractive in terms of sustainability, image segmentation being a new type of challenge for this team, and having a topic that would be easy to explain and visualize at events.
In order to accomplish this, we will perform some EDA on the Disneyland dataset, and then we will view the visualization on the Comet experimentation website or platform. Another significant aspect of Comet is that it enables us to carry out exploratory dataanalysis. Let’s get started! You can learn more about Comet here.
This is a unique opportunity for data people to dive into real-world data and uncover insights that could shape the future of aviation safety, understanding, airline efficiency, and pilots driving planes. Their primary objective is to develop advanced models that accurately predict future weather conditions at KMIA (Miami Airport).
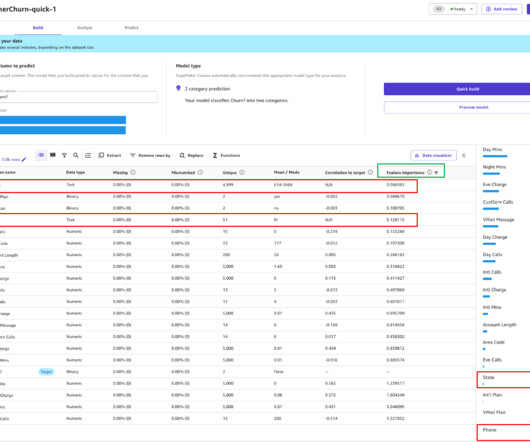
We use the model preview functionality to perform an initial EDA. This provides us a baseline that we can use to perform data augmentation, generating a new baseline, and finally getting the best model with a model-centric approach using the standard build functionality.
In a typical MLOps project, similar scheduling is essential to handle new data and track model performance continuously. Load and Explore Data We load the Telco Customer Churn dataset and perform exploratory dataanalysis (EDA). Experiment Tracking in CometML (Image by the Author) 2.
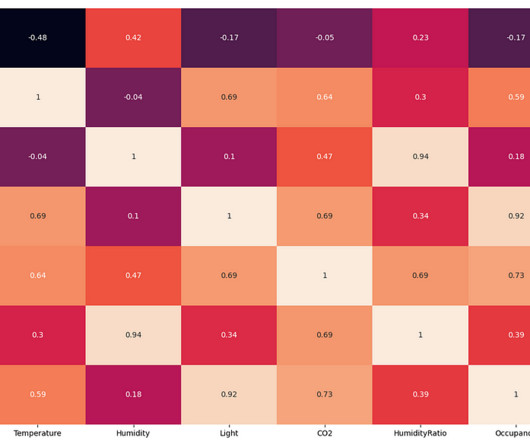
From the above EDA, it is clear that the room's temperature, light, and CO2 levels are good occupancy indicators. The exploratory dataanalysis found that the change in room temperature, CO levels, and light intensity can be used to predict the occupancy of the room in place of humidity and humidity ratio.
Some of the most serious effects of global warming include rising sea levels, more extreme weather events, changes in animal and plant life, and soil health & erosion. Here we use data science to diagnose the issues and propose better practices to treat our planet better than the last 30 years.
Making Data Stationary: Many forecasting models assume stationarity. If the data is non-stationary, apply transformations like differencing or logarithmic scaling to stabilize its statistical properties. Exploratory DataAnalysis (EDA): Conduct EDA to identify trends, seasonal patterns, and correlations within the dataset.
Create DataGrids with image data using Kangas, and load and visualize image data from hugging face Photo by Genny Dimitrakopoulou on Unsplash Visualizing data to carry out a detailed EDA, especially for image data, is critical.
There are 6 high-level steps in every MLOps project The 6 steps are: Initial data gathering (for exploration). Exploratory dataanalysis (EDA) and modeling. Data and model pipeline development (data preparation, training, evaluation, and so on).
Diagnostic Analytics Projects: Diagnostic analytics seeks to determine the reasons behind specific events or patterns observed in the data. It involves deeper analysis and investigation to identify the root causes of problems or successes. Root cause analysis is a typical diagnostic analytics task.
Data Cleaning: Raw data often contains errors, inconsistencies, and missing values. Data cleaning identifies and addresses these issues to ensure data quality and integrity. Data Visualisation: Effective communication of insights is crucial in Data Science.
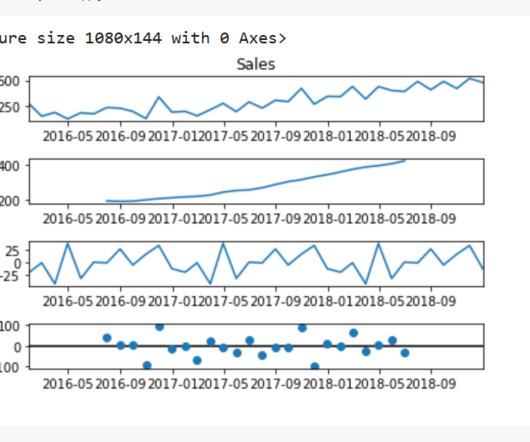
The Art of Forecasting in the Retail Industry Part I : Exploratory DataAnalysis & Time Series Analysis In this article, I will conduct exploratory dataanalysis and time series analysis using a dataset consisting of product sales in different categories from a store in the US between 2015 and 2018.
In this article, let’s dive deep into the Natural Language Toolkit (NLTK) data processing concepts for NLP data. Before building our model, we will also see how we can visualize this data with Kangas as part of exploratory dataanalysis (EDA).
It is therefore important to carefully plan and execute data preparation tasks to ensure the best possible performance of the machine learning model. It is also essential to evaluate the quality of the dataset by conducting exploratory dataanalysis (EDA), which involves analyzing the dataset’s distribution, frequency, and diversity of text.
We first get a snapshot of our data by visually inspecting it and also performing minimal Exploratory DataAnalysis just to make this article easier to follow through. In a real-life scenario you can expect to do more EDA, but for the sake of simplicity we’ll do just enough to get a sense of the process.
Mid-point review and challenge Q&A event. This challenge included two optional milestones to help solvers understand the challenge goals and learn how well their solution aligned with those goals, an opportunity to get feedback via a mid-point review and a Q&A event. Overall and bonus prize structure.
We organize all of the trending information in your field so you don't have to. Join 17,000+ users and stay up to date on the latest articles your peers are reading.
You know about us, now we want to get to know you!
Let's personalize your content
Let's get even more personalized
We recognize your account from another site in our network, please click 'Send Email' below to continue with verifying your account and setting a password.


Let's personalize your content