This site uses cookies to improve your experience. To help us insure we adhere to various privacy regulations, please select your country/region of residence. If you do not select a country, we will assume you are from the United States. Select your Cookie Settings or view our Privacy Policy and Terms of Use.
Cookie Settings
Cookies and similar technologies are used on this website for proper function of the website, for tracking performance analytics and for marketing purposes. We and some of our third-party providers may use cookie data for various purposes. Please review the cookie settings below and choose your preference.
Used for the proper function of the website
Used for monitoring website traffic and interactions
Cookie Settings
Cookies and similar technologies are used on this website for proper function of the website, for tracking performance analytics and for marketing purposes. We and some of our third-party providers may use cookie data for various purposes. Please review the cookie settings below and choose your preference.
Strictly Necessary: Used for the proper function of the website
Performance/Analytics: Used for monitoring website traffic and interactions
In this blog, we will discuss exploratory dataanalysis, also known as EDA, and why it is important. We will also be sharing code snippets so you can try out different analysis techniques yourself. EDA is an iterative process of conglomerative activities which include data cleaning, manipulation and visualization.
Performing exploratory dataanalysis to gain insights into the dataset’s structure. Whether you’re a data scientist aiming to deepen your expertise in NLP or a machine learning engineer interested in domain-specific model fine-tuning, this tutorial will equip you with the tools and insights you need to get started.
You may combine event data (e.g., shot types and results) with tracking data (e.g., Effective data collection ensures you have all the necessary information to begin the analysis, setting the stage for reliable insights into improving shot conversion rates or any other defined problem.
The importance of EDA in the machine learning world is well known to its users. Making visualizations is one of the finest ways for data scientists to explain dataanalysis to people outside the business. Exploratory dataanalysis can help you comprehend your data better, which can aid in future data preprocessing.
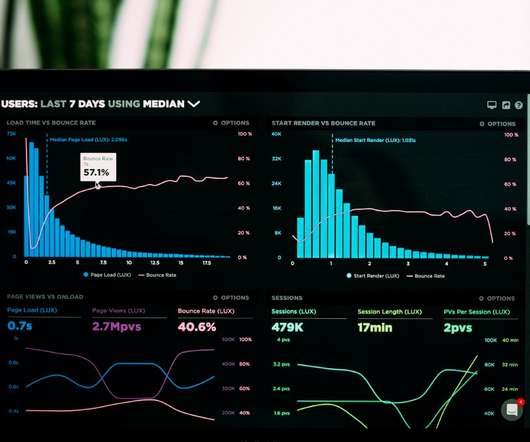
Photo by Luke Chesser on Unsplash EDA is a powerful method to get insights from the data that can solve many unsolvable problems in business. In the increasingly competitive world, understanding the data and taking quicker actions based on that help create differentiation for the organization to stay ahead!
Cleaning data: Once the data has been gathered, it needs to be cleaned. This involves removing any errors or inconsistencies in the data. Exploratory dataanalysis (EDA): EDA is a process of exploring data to gain insights into its distribution, relationships, and patterns.
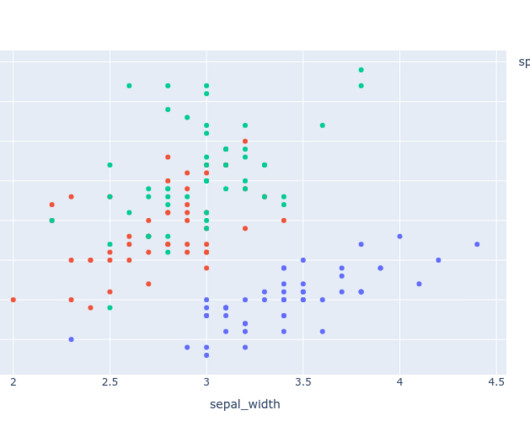
Summary: Exploratory DataAnalysis (EDA) uses visualizations to uncover patterns and trends in your data. Histograms, scatter plots, and charts reveal relationships and outliers, helping you understand your data and make informed decisions. Imagine a vast, uncharted territory – your data set.
Summary: DataAnalysis focuses on extracting meaningful insights from raw data using statistical and analytical methods, while data visualization transforms these insights into visual formats like graphs and charts for better comprehension. But raw data, in its unprocessed state, is often just noise.
Summary: The Data Science and DataAnalysis life cycles are systematic processes crucial for uncovering insights from raw data. Quality data is foundational for accurate analysis, ensuring businesses stay competitive in the digital landscape. billion INR by 2026, with a CAGR of 27.7%.
Summary: This article explores different types of DataAnalysis, including descriptive, exploratory, inferential, predictive, diagnostic, and prescriptive analysis. Introduction DataAnalysis transforms raw data into valuable insights that drive informed decisions. What is DataAnalysis?
Discover the power of Python libraries for (partial) automation of Exploratory DataAnalysis (EDA). These tools empower both seasoned Data Scientists and beginners to explore datasets efficiently, extracting meaningful insights without the usual time constraints. What are auto EDA libraires?
When it comes to data analytics , not much is easier to use than a spreadsheet. For this reason, spreadsheets have been the predominant tool when it comes to basic dataanalysis for the past 20 years. If you work with data, you’ve done work in Excel or Google Sheets. Easy Smeasy. Great Power. So, what is Mito?
This article seeks to also explain fundamental topics in data science such as EDA automation, pipelines, ROC-AUC curve (how results will be evaluated), and Principal Component Analysis in a simple way. The dataset originated from Health Verity, one of the largest healthcare data ecosystems in the US. Figure 5: Code Magic!
Photo by Joshua Sortino on Unsplash Dataanalysis is an essential part of any research or business project. Before conducting any formal statistical analysis, it’s important to conduct exploratory dataanalysis (EDA) to better understand the data and identify any patterns or relationships.
Some projects may necessitate a comprehensive LLMOps approach, spanning tasks from data preparation to pipeline production. Exploratory DataAnalysis (EDA) Data collection: The first step in LLMOps is to collect the data that will be used to train the LLM. What are the benefits of LLMOps?
Exploratory DataAnalysis on Stock Market Data Photo by Lukas Blazek on Unsplash Exploratory DataAnalysis (EDA) is a crucial step in data science projects. It helps in understanding the underlying patterns and relationships in the data. Load the Dataset The first step is to load the dataset.
There are many well-known libraries and platforms for dataanalysis such as Pandas and Tableau, in addition to analytical databases like ClickHouse, MariaDB, Apache Druid, Apache Pinot, Google BigQuery, Amazon RedShift, etc. These tools will help make your initial data exploration process easy.
Photo by Juraj Gabriel on Unsplash Dataanalysis is a powerful tool that helps businesses make informed decisions. In this blog, we’ll be using Python to perform exploratory dataanalysis (EDA) on a Netflix dataset that we’ve found on Kaggle. df['rating'].replace(np.nan, Hope you enjoy this article.
This article will guide you through effective strategies to learn Python for Data Science, covering essential resources, libraries, and practical applications to kickstart your journey in this thriving field. Key Takeaways Python’s simplicity makes it ideal for DataAnalysis. in 2022, according to the PYPL Index.
Agenda · EDA· The Missed Goal· The Kaggle Syndrome· Regression That Works· Personalisation· Parting Words· References EDA Although the Kaggle Black Friday Prediction dataset is popular, its purpose is unclear, and there is no data dictionary to explain the data in detail. Let’s skip over the EDA.
Summary: Big Data refers to the vast volumes of structured and unstructured data generated at high speed, requiring specialized tools for storage and processing. Data Science, on the other hand, uses scientific methods and algorithms to analyses this data, extract insights, and inform decisions.
Today’s question is, “What does a data scientist do.” ” Step into the realm of data science, where numbers dance like fireflies and patterns emerge from the chaos of information. In this blog post, we’re embarking on a thrilling expedition to demystify the enigmatic role of data scientists.
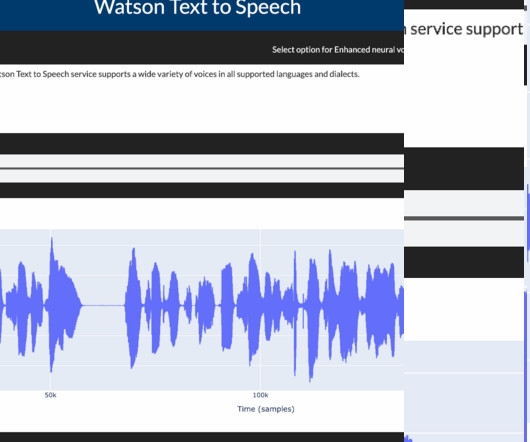
Data Processing and EDA (Exploratory DataAnalysis) Speech synthesis services require that the data be in a JSON format. For more information, Embeddable AI Webpage. To learn more about using the s ingle-container TTS service you can see here.
A data analyst deals with a vast amount of information daily. Continuously working with data can sometimes lead to a mistake. In this article, we will be exploring 10 such common mistakes that every data analyst makes. Overlooking Data Quality The quality of the data you are working on also plays a significant role.
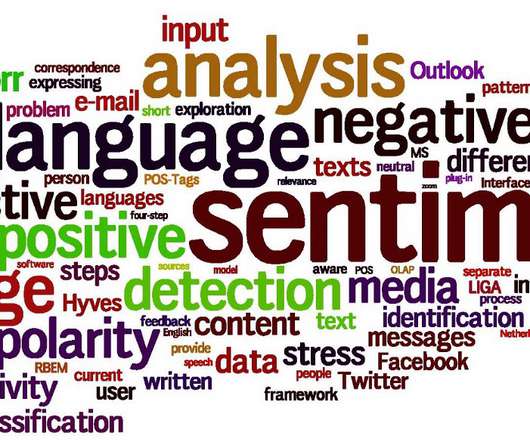
By analyzing the sentiment of users towards certain products, services, or topics, sentiment analysis provides valuable insights that empower businesses and organizations to make informed decisions, gauge public opinion, and improve customer experiences.
Theoretical Explanations and Practical Examples of Correlation between Categorical and Continuous Values Without any doubt, after obtaining the dataset, giving entire data to any ML model without any dataanalysis methods such as missing dataanalysis, outlier analysis, and correlation analysis.
Data developers no longer have to worry about the limitations of working with large datasets and can focus on analyzing and interpreting the data. In this article, I will provide a detailed overview of Kangas, including information on how to install it and its advantages over other Python libraries. What is Comet?
Now more than ever, we are also seeing financial institutions increasingly leverage HPC for capabilities like Monte Carlo simulations on market movements, including to power artificial intelligence (AI) and machine learning solutions that can be used to help enterprises make more informed decisions.
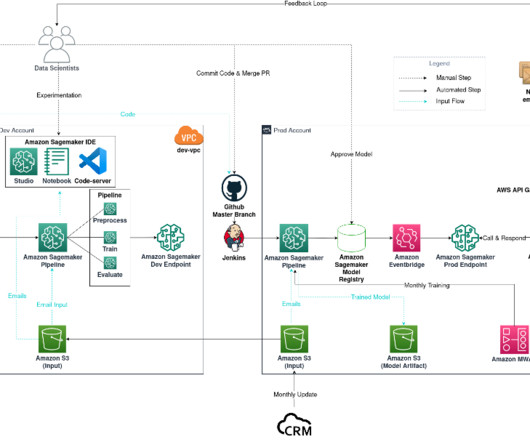
Email classification project diagram The workflow consists of the following components: Model experimentation – Data scientists use Amazon SageMaker Studio to carry out the first steps in the data science lifecycle: exploratory dataanalysis (EDA), data cleaning and preparation, and building prototype models.
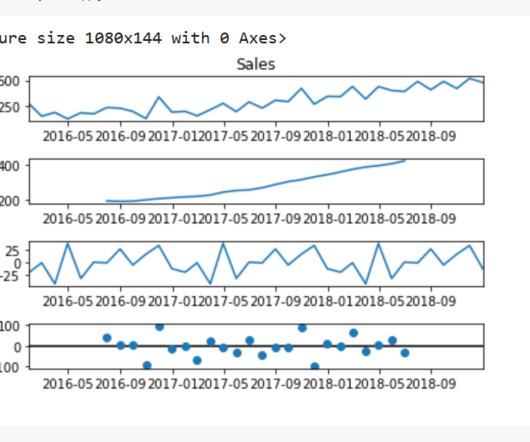
We will carry out some EDA on our dataset, and then we will log the visualizations onto the Comet experimentation website or platform. Time Series Models Time series models are a type of statistical model that are used to analyze and make predictions about data that is collected over time. Without further ado, let’s begin.
First of all, HR needs to collect comprehensive data about an employee, such as education, salary, experience… We also need data from supervisors such as performance, relationships, promotions… After that, HR can use this information to predict employees’ tendency to leave and take preventive action.
Objectives The challenge embraced several dataanalysis dimensions: from data cleaning and exploratory dataanalysis (EDA) to insightful data visualization and predictive modeling. About Ocean Protocol Ocean was founded to level the playing field for AI and data.
Choosing the proper library improves data exploration, presentation, and industry decision-making. Introduction Data visualisation plays a crucial role in DataAnalysis by transforming complex datasets into insightful, easy-to-understand visuals. It helps uncover patterns, trends, and correlations that might go unnoticed.
These communities will help you to be updated in the field, because there are some experienced data scientists posting the stuff, or you can talk with them so they will also guide you in your journey. DataAnalysis After learning math now, you are able to talk with your data.
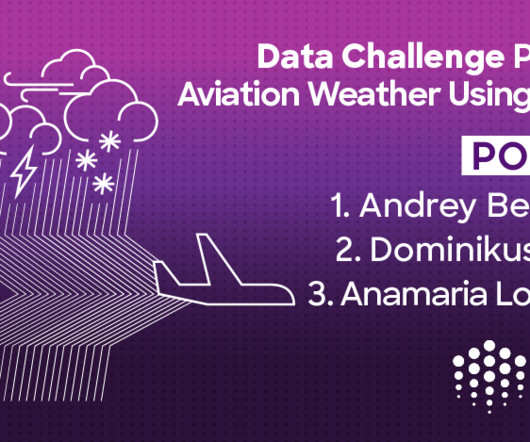
METAR, Miami International Airport (KMIA) on March 9, 2024, at 15:00 UTC In the recently concluded data challenge hosted on Desights.ai , participants used exploratory dataanalysis (EDA) and advanced artificial intelligence (AI) techniques to enhance aviation weather forecasting accuracy.
It supports Pearson, Kendall, and Spearman methods, aiding in insightful DataAnalysis. Introduction Pandas is a powerful Python library widely used for DataAnalysis. It offers flexible and efficient data manipulation tools. This article explores using Pandas’s corr() method for effective DataAnalysis.
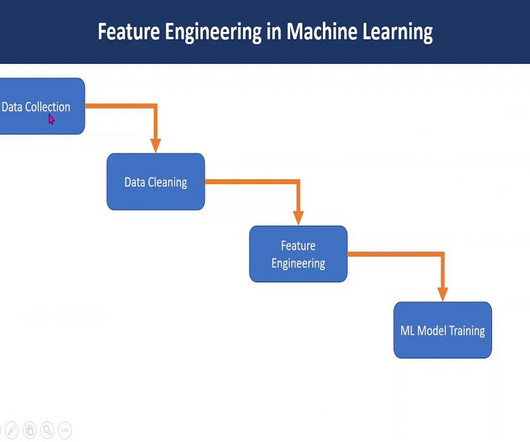
Feature engineering in machine learning is a pivotal process that transforms raw data into a format comprehensible to algorithms. Through Exploratory DataAnalysis , imputation, and outlier handling, robust models are crafted. Time features Objective: Extracting valuable information from time-related data.
With expertise in programming languages like Python , Java , SQL, and knowledge of big data technologies like Hadoop and Spark, data engineers optimize pipelines for data scientists and analysts to access valuable insights efficiently. Role of Data Scientists Data Scientists are the architects of dataanalysis.
Separately, the company uses AWS data services, such as Amazon Simple Storage Service (Amazon S3), to store data related to patients, such as patient information, device ownership details, and clinical telemetry data obtained from the wearables. For Analysis type , choose Data Quality and Insights Report.
Principal Component Analysis(PCA) is an essential algorithm in a data scientist's toolkit. It is used to reduce the dimensionality of a dataset while retaining as much of the original information as possible. This shows the data will likely be classified using linear algorithms.
Data Extraction, Preprocessing & EDA & Machine Learning Model development Data collection : Automatically download the stock historical prices data in CSV format and save it to the AWS S3 bucket. Data storage : Store the data in a Snowflake data warehouse by creating a data pipe between AWS and Snowflake.
This technique is widely used across various fields, including economics, finance, biology, engineering, and social sciences, to make predictions and inform decision-making. This data can come from various sources such as surveys, experiments, or historical records.
F1 :: 2024 Strategy Analysis Poster ‘The Formula 1 Racing Challenge’ challenges participants to analyze race strategies during the 2024 season. They will work with lap-by-lap data to assess how pit stop timing, tire selection, and stint management influence race performance.
Source:datascientist.com Sentiment analysis, commonly referred to as “opinion mining,” is the method of drawing out irrational information from written or spoken words. Customer service, marketing, and political analysis are just a few of the many uses for sentiment analysis. Let’s get started!
We organize all of the trending information in your field so you don't have to. Join 17,000+ users and stay up to date on the latest articles your peers are reading.
You know about us, now we want to get to know you!
Let's personalize your content
Let's get even more personalized
We recognize your account from another site in our network, please click 'Send Email' below to continue with verifying your account and setting a password.


Let's personalize your content