This site uses cookies to improve your experience. To help us insure we adhere to various privacy regulations, please select your country/region of residence. If you do not select a country, we will assume you are from the United States. Select your Cookie Settings or view our Privacy Policy and Terms of Use.
Cookie Settings
Cookies and similar technologies are used on this website for proper function of the website, for tracking performance analytics and for marketing purposes. We and some of our third-party providers may use cookie data for various purposes. Please review the cookie settings below and choose your preference.
Used for the proper function of the website
Used for monitoring website traffic and interactions
Cookie Settings
Cookies and similar technologies are used on this website for proper function of the website, for tracking performance analytics and for marketing purposes. We and some of our third-party providers may use cookie data for various purposes. Please review the cookie settings below and choose your preference.
Strictly Necessary: Used for the proper function of the website
Performance/Analytics: Used for monitoring website traffic and interactions
Introduction SQL is a database programming language created for managing and retrieving data from Relational databases like MySQL, Oracle, and SQL Server. SQL(Structured Query Language) is the common language for all databases. In other terms, SQL is a language that communicates with databases.
For instance, Berkeley’s Division of Data Science and Information points out that entry level data science jobs remote in healthcare involves skills in NLP (Natural Language Processing) for patient and genomic dataanalysis, whereas remote data science jobs in finance leans more on skills in risk modeling and quantitative analysis.
Photo by Nathan Dumlao on Unsplash Let’s dive into the world of dataanalysis. Assuming that you are a data analyst, If not I will help you to become a data analyst by taking you through my experience in the field of dataanalysis. There is just efficient or inefficient dataanalysis only.
In the process of working on their ML tasks, data scientists typically start their workflow by discovering relevant data sources and connecting to them. They then use SQL to explore, analyze, visualize, and integrate data from various sources before using it in their ML training and inference.
Though both are great to learn, what gets left out of the conversation is a simple yet powerful programming language that everyone in the data science world can agree on, SQL. But why is SQL, or Structured Query Language , so important to learn? Let’s start with the first clause often learned by new SQL users, the WHERE clause.
In the context of data science, software engineers play a crucial role in creating robust and efficient software tools that facilitate data scientists’ work. They collaborate with data scientists to ensure that the software meets their needs and supports their dataanalysis and modeling tasks.
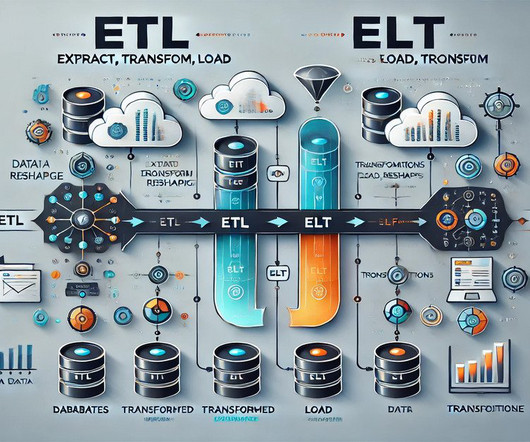
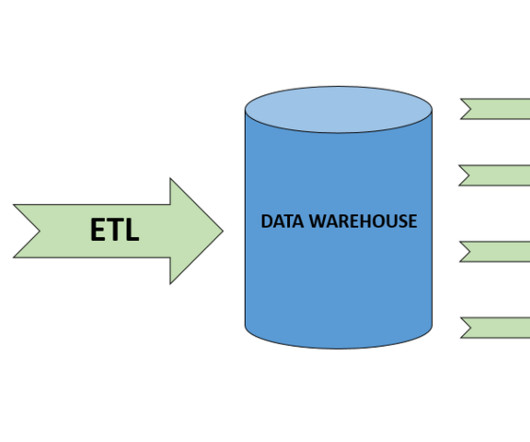
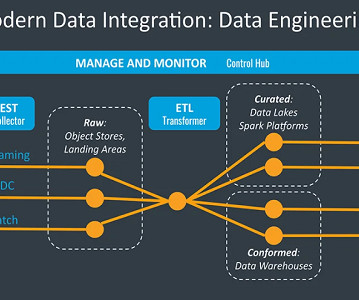
Summary: This blog explores the key differences between ETL and ELT, detailing their processes, advantages, and disadvantages. Understanding these methods helps organizations optimize their data workflows for better decision-making. What is ETL? ETL stands for Extract, Transform, and Load.
SageMaker Unied Studio is an integrated development environment (IDE) for data, analytics, and AI. Discover your data and put it to work using familiar AWS tools to complete end-to-end development workflows, including dataanalysis, data processing, model training, generative AI app building, and more, in a single governed environment.
Sigma Computing , a cloud-based analytics platform, helps data analysts and business professionals maximize their data with collaborative and scalable analytics. One of Sigma’s key features is its support for custom SQL queries and CSV file uploads. These tools allow users to handle more advanced data tasks and analyses.
The storage and processing of data through a cloud-based system of applications. Master data management. The techniques for managing organisational data in a standardised approach that minimises inefficiency. Extraction, Transform, Load (ETL). Data transformation.
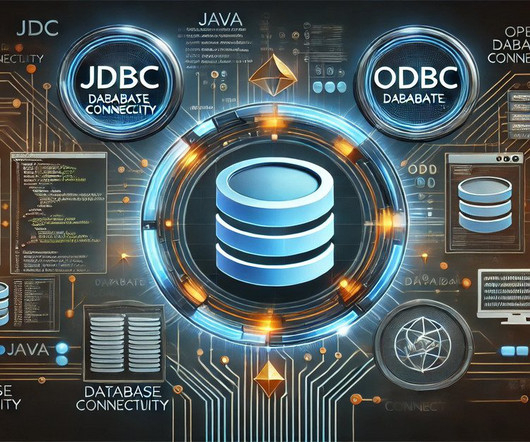
It allows developers to easily connect to databases, execute SQL queries, and retrieve data. It operates as an intermediary, translating Java calls into SQL commands the database understands. For instance, reporting and analytics tools commonly use it to pull data from various database systems. from 2023 to 2030.
Here’s a list of key skills that are typically covered in a good data science bootcamp: Programming Languages : Python : Widely used for its simplicity and extensive libraries for dataanalysis and machine learning. R : Often used for statistical analysis and data visualization.
Summary: Business Intelligence Analysts transform raw data into actionable insights. They use tools and techniques to analyse data, create reports, and support strategic decisions. Key skills include SQL, data visualization, and business acumen. Introduction We are living in an era defined by data.
Evaluate integration capabilities with existing data sources and Extract Transform and Load (ETL) tools. Its PostgreSQL foundation ensures compatibility with most SQL clients. Strengths : Real-time analytics, built-in machine learning capabilities, and fast querying with standard SQL.
Hive is a data warehousing infrastructure built on top of Hadoop. It has the following features: It facilitates querying, summarizing, and analyzing large datasets Hadoop also provides a SQL-like language called HiveQL Hive allows users to write queries to extract valuable insights from structured and semi-structured data stored in Hadoop.
This comprehensive blog outlines vital aspects of Data Analyst interviews, offering insights into technical, behavioural, and industry-specific questions. It covers essential topics such as SQL queries, data visualization, statistical analysis, machine learning concepts, and data manipulation techniques.
Data engineers are essential professionals responsible for designing, constructing, and maintaining an organization’s data infrastructure. They create data pipelines, ETL processes, and databases to facilitate smooth data flow and storage. Data Visualization: Matplotlib, Seaborn, Tableau, etc.
We looked at over 25,000 job descriptions, and these are the data analytics platforms, tools, and skills that employers are looking for in 2023. Excel is the second most sought-after tool in our chart as you’ll see below as it’s still an industry standard for data management and analytics.
Here are steps you can follow to pursue a career as a BI Developer: Acquire a solid foundation in data and analytics: Start by building a strong understanding of data concepts, relational databases, SQL (Structured Query Language), and data modeling.
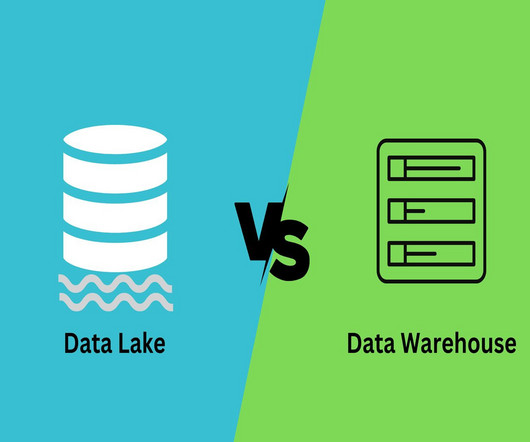
They all agree that a Datamart is a subject-oriented subset of a data warehouse focusing on a particular business unit, department, subject area, or business functionality. The Datamart’s data is usually stored in databases containing a moving frame required for dataanalysis, not the full history of data.
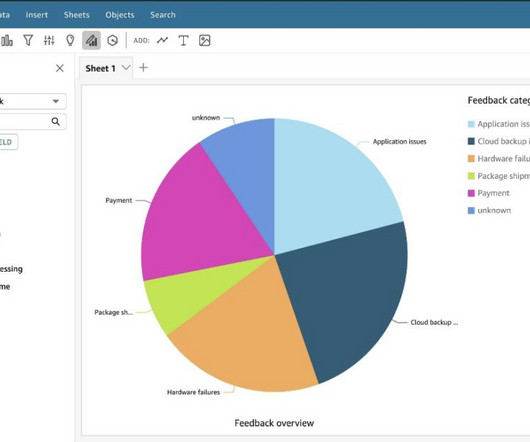
In addition, the generative business intelligence (BI) capabilities of QuickSight allow you to ask questions about customer feedback using natural language, without the need to write SQL queries or learn a BI tool.
BI involves using data mining, reporting, and querying techniques to identify key business metrics and KPIs that can help companies make informed decisions. A career path in BI can be a lucrative and rewarding choice for those with interest in dataanalysis and problem-solving. How to become a blockchain maestro?
BI involves using data mining, reporting, and querying techniques to identify key business metrics and KPIs that can help companies make informed decisions. A career path in BI can be a lucrative and rewarding choice for those with interest in dataanalysis and problem-solving. How to become a blockchain maestro?
What Is a Data Warehouse? On the other hand, a Data Warehouse is a structured storage system designed for efficient querying and analysis. It involves the extraction, transformation, and loading (ETL) process to organize data for business intelligence purposes. It often serves as a source for Data Warehouses.
Your journey ends here where you will learn the essential handy tips quickly and efficiently with proper explanations which will make any type of data importing journey into the Python platform super easy. Introduction Are you a Python enthusiast looking to import data into your code with ease?
Proper data preprocessing is essential as it greatly impacts the model performance and the overall success of dataanalysis tasks ( Image Credit ) Data integration Data integration involves combining data from various sources and formats into a unified and consistent dataset.
Use Cases of Hadoop Hadoop is widely used in finance, healthcare, and retail industries for fraud detection, risk analysis, customer segmentation, and large-scale data storage. It also supports ETL (Extract, Transform, Load) processes, making data warehousing and analytics essential. What is Apache Spark?
Furthermore, Alteryx provides an array of tools and connectors tailored for different data sources, spanning Excel spreadsheets, databases, and social media platforms. Data Analytics automation Alteryx’s standout feature lies in its capability to automate data analytics workflows. Is Alteryx an ETL tool?
Like with any professional shift, it’s always good practice to take inventory of your existing data science strengths. Data scientists typically have strong skills in areas such as Python, R, statistics, machine learning, and dataanalysis. With that said, each skill may be used in a different manner.
Improved Data Navigation Hierarchies provide a clear structure for users to navigate through data. Enhanced DataAnalysis By allowing users to drill down into data, hierarchies enable more detailed analysis. They enable intuitive querying and reporting by providing a clear structure for data exploration.
Data Integration Once data is collected from various sources, it needs to be integrated into a cohesive format. Data Quality Management : Ensures that the integrated data is accurate, consistent, and reliable for analysis. These tools work together to facilitate efficient data management and analysis processes.
It enables reporting and DataAnalysis and provides a historical data record that can be used for decision-making. Key components of data warehousing include: ETL Processes: ETL stands for Extract, Transform, Load. ETL is vital for ensuring data quality and integrity.
And that’s what we’re going to focus on in this article, which is the second in my series on Software Patterns for Data Science & ML Engineering. I’ll show you best practices for using Jupyter Notebooks for exploratory dataanalysis. When data science was sexy , notebooks weren’t a thing yet. documentation.
ThoughtSpot is a cloud-based AI-powered analytics platform that uses natural language processing (NLP) or natural language query (NLQ) to quickly query results and generate visualizations without the user needing to know any SQL or table relations. Suppose your business requires more robust capabilities across your technology stack.
With Snowflake, organizations can be data consumers, data providers, or both. Complete SQL Database No need to learn new tools as Snowflake supports the tools millions of business users already know how to use today.
Finally, Tableau allows you to create custom territories using Tableau groups and overlay data with demographic information, giving you a comprehensive view of your data. ODBC is an industry standard that allows various software to access data.
Its core components include: Lakehouse : Offers robust data storage and processing capabilities. Data Factory : Simplifies the creation of ETL pipelines to integrate data from diverse sources. Developed by Microsoft, it is designed to simplify DataAnalysis for users at all levels, from beginners to advanced analysts.
This technique accommodates diverse and evolving data formats and schemas, enabling agility and exploration within the data lake. There are tools designed specifically to analyze your data lake files, determine the schema, and allow for SQL statements to be run directly off this data.
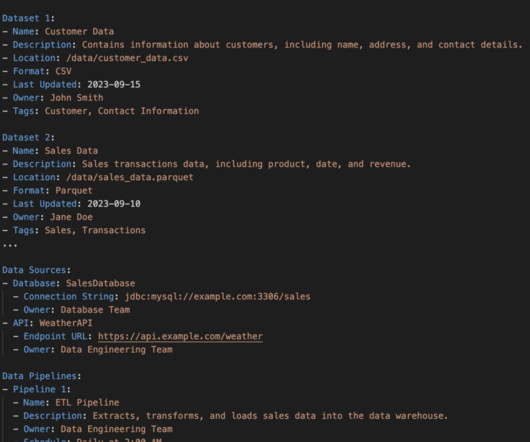
Here’s the structured equivalent of this same data in tabular form: With structured data, you can use query languages like SQL to extract and interpret information. In contrast, such traditional query languages struggle to interpret unstructured data. is similar to the traditional Extract, Transform, Load (ETL) process.
Traditionally, answering this question would involve multiple data exports, complex extract, transform, and load (ETL) processes, and careful data synchronization across systems. Users can write data to managed RMS tables using Iceberg APIs, Amazon Redshift, or Zero-ETL ingestion from supported data sources.
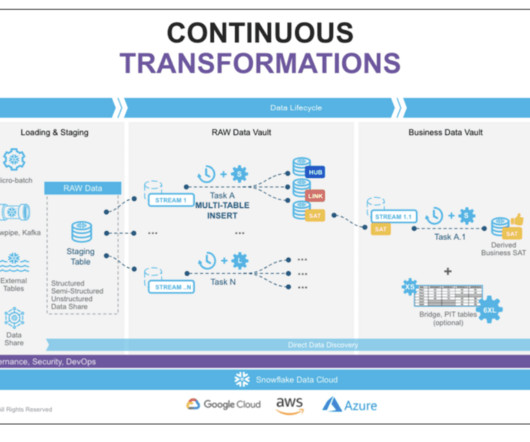
Snowflake’s managed data processing unit called “Tasks” wakes up at a defined interval and checks for data in the associated stream. If data is present, Tasks runs SQL to push it to the raw data vault objects. This setup facilitates tracking of sensitive data usage and reduced access control management overheads.
In this blog, well explore the 5 key components of Power BI , their features, and how they can help you make data-driven decisions. Key Takeaways User-Friendly Interface: Simplifies dataanalysis for non-technical users. Key Features Data Import: Connects to multiple data sources like Excel, SQL Server, or cloud services.
This allows iterative dataanalysis workflows rather than rigid scripts. Python forms a common lingua franca for open data science thanks to its flexibility and the breadth of domain-specific packages continuously expanded by the active community. automatically produces visualizationsno SQL query or Python coding required.
Summary: Data engineering tools streamline data collection, storage, and processing. Tools like Python, SQL, Apache Spark, and Snowflake help engineers automate workflows and improve efficiency. Learning these tools is crucial for building scalable data pipelines.
We organize all of the trending information in your field so you don't have to. Join 17,000+ users and stay up to date on the latest articles your peers are reading.
You know about us, now we want to get to know you!
Let's personalize your content
Let's get even more personalized
We recognize your account from another site in our network, please click 'Send Email' below to continue with verifying your account and setting a password.


Let's personalize your content