This site uses cookies to improve your experience. To help us insure we adhere to various privacy regulations, please select your country/region of residence. If you do not select a country, we will assume you are from the United States. Select your Cookie Settings or view our Privacy Policy and Terms of Use.
Cookie Settings
Cookies and similar technologies are used on this website for proper function of the website, for tracking performance analytics and for marketing purposes. We and some of our third-party providers may use cookie data for various purposes. Please review the cookie settings below and choose your preference.
Used for the proper function of the website
Used for monitoring website traffic and interactions
Cookie Settings
Cookies and similar technologies are used on this website for proper function of the website, for tracking performance analytics and for marketing purposes. We and some of our third-party providers may use cookie data for various purposes. Please review the cookie settings below and choose your preference.
Strictly Necessary: Used for the proper function of the website
Performance/Analytics: Used for monitoring website traffic and interactions
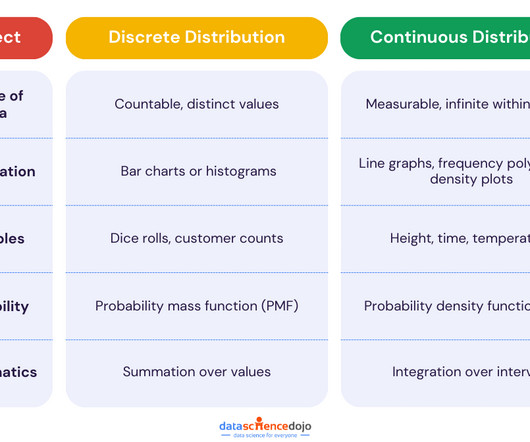
In the realm of dataanalysis, understanding data distributions is crucial. It is also important to understand the discrete vs continuous data distribution debate to make informed decisions. This map is essential for making sense of your data, revealing patterns, and guiding you on the journey to meaningful insights.
Introduction Dataanalysis and visualization are powerful tools that enable us to make sense of complex datasets and communicate insights effectively. In this immersive exploration of real-world conflict data, we delve deep into the gritty realities and complexities of conflicts.
Get ahead in dataanalysis with our summary of the top 7 must-know statistical techniques. Top statistical techniques – Data Science Dojo Counterfactual causal inference: Counterfactual causal inference is a statistical technique that is used to evaluate the causal significance of historical events.
That’s akin to the experience of sifting through today’s digital news landscape, except instead of a magical test, we have the power of dataanalysis to help us find the news that matters most to us.
1] The need to improve real-time decision-making is contributing to a growing demand for event-driven solutions and their ability to help businesses achieve continuous intelligence and situation awareness. An event-driven architecture focuses on the publication, capture, processing and storage of events.
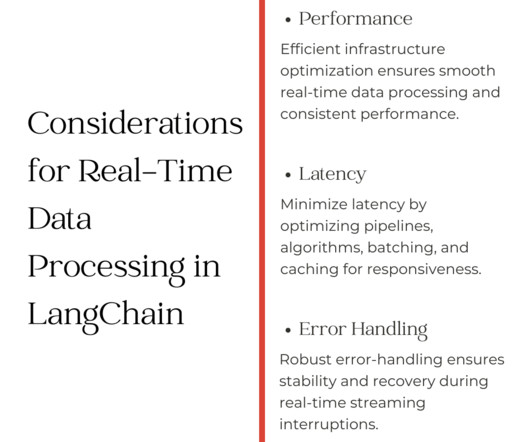
Live DataAnalysis: Applications that can analyze and act on continuously flowing data, such as financial market updates, weather reports, or social media feeds, in real-time. Here’s a basic example that implements streaming on the LLM response: Prerequisite: Install Python: Make sure you have installed Python 3.8
As climate change increases the frequency of extreme weather conditions, such as droughts and floods, contingency planning and risk assessment are becoming increasingly crucial for managing such events. This article […] The post Flood Risk Assessment Using Digital Elevation and the HAND Models appeared first on Analytics Vidhya.
By leveraging these charts, users can enhance DataAnalysis, reveal critical insights, and support data-driven decisions, transforming Excel into a powerful visualisation tool for complex data. Introduction Microsoft Excel is a powerful tool for data visualisation. Why Use Advanced Excel Charts in DataAnalysis?
making it a fundamental model for simple binary events. Poisson distribution The Poisson distribution models the number of events occurring in a fixed interval of time or space, assuming a constant rate. Exponential distribution The exponential distribution represents the time until a continuous, random event occurs.
The Poisson process is a popular method of counting random events that occur at a certain rate. It is commonly used in situations where the timing of events appears to be random, but the rate of occurrence is known. where lambda is the rate parameter and x!
For instance, Berkeley’s Division of Data Science and Information points out that entry level data science jobs remote in healthcare involves skills in NLP (Natural Language Processing) for patient and genomic dataanalysis, whereas remote data science jobs in finance leans more on skills in risk modeling and quantitative analysis.
What constitutes an odd event? Introduction Datasets are to machine learning models what experiences are to human beings. Have you ever witnessed a strange occurrence? What exactly do you consider to be strange? Is it based on comparisons with uncommon circumstances or things that […].
By leveraging AI for real-time event processing, businesses can connect the dots between disparate events to detect and respond to new trends, threats and opportunities. AI and event processing: a two-way street An event-driven architecture is essential for accelerating the speed of business.
This article was published as a part of the Data Science Blogathon Introduction A news article discusses current or recent news of either general interest (i.e. A news article can include accounts of eyewitnesses to the happening event. […]. daily newspapers) or on a specific topic (i.e.
New big data architectures and, above all, data sharing concepts such as Data Mesh are ideal for creating a common database for many data products and applications. The Event Log Data Model for Process Mining Process Mining as an analytical system can very well be imagined as an iceberg.
By using intelligent algorithms, real-time dataanalysis, and even emotional cues, AI has emerged as the ultimate networking wingman. Examples of icebreaking features: Event-specific prompts: Apps analyze event agendas to recommend topical conversation starters. The answer might be artificial intelligence.
Through each exercise, you’ll learn important data science skills as well as “best practices” for using pandas. By the end of the tutorial, you’ll be more fluent at using pandas to correctly and efficiently answer your own data science questions. Table of Contents: Exploratory DataAnalysis is all about answering a specific question.
From uncovering hidden patterns to providing actionable recommendations, generative AI’s proficiency in data analytics heralds a new era where innovation spans the spectrum from artistic expression to informed business strategies. So let’s take a brief look at some examples of how generative AI can be used for data analytics.
Seasonal changes, festivals, and cultural events often bring about these variances. Introduction Trends that repeat themselves over days or months are called seasonality in time series. Understanding these patterns is essential since they greatly influence corporate results and decision-making.
Stress can be triggered by a variety of factors, such as work-related pressure, financial difficulties, relationship problems, health issues, or major life events. […] The post Machine Learning Unlocks Insights For Stress Detection appeared first on Analytics Vidhya.
This will be the second Sistech Networking event in Greece, celebrating refugee women talents and the companies who do support their professional inclusion & hire them. Sistech offers free and holistic support based on three pillars: mentoring and training follow-up by volunteer professionals and networking events.
Advantages of event-driven solutions This is where event-driven solutions excel. Working with “business events” is essential for unlocking real-time insights that enable intelligent decision making and automated responses. 3 reasons to take advantage of event-driven solutions 1.
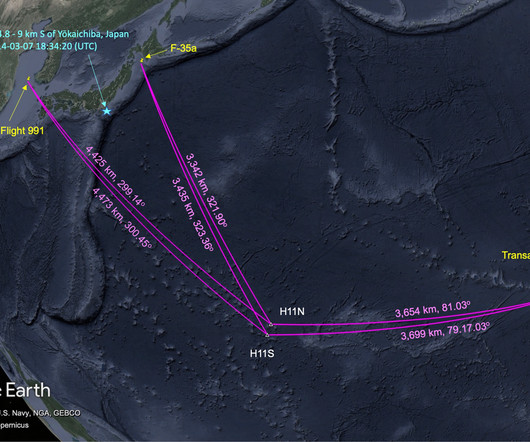
Dataanalysis from the hydroacoustic stations of the Comprehensive Nuclear-Test-Ban Treaty Organization has unveiled distinctive pressure signals linked to aircraft crashes of varying sizes in the ocean. They emphasise the potential for hydrophones to detect events even when the signal travels long distances through land.
In this blog, we will discuss the importance of probability in data science, its applications, and how it can be used to make data-driven decisions. It is a measure of the likelihood of an event occurring. In data science, it is used to quantify the uncertainty associated with data. What is probability?
These tools have proven to be incredibly useful in a variety of tasks, from dataanalysis to streamlining processes and boosting productivity. With over 20 industry experts, this conference is a must-attend event for anyone looking to stay at the forefront of this rapidly evolving field.
Summary: This article explores different types of DataAnalysis, including descriptive, exploratory, inferential, predictive, diagnostic, and prescriptive analysis. Introduction DataAnalysis transforms raw data into valuable insights that drive informed decisions. What is DataAnalysis?
To create a simple game using Pygame, you will need to understand the basics of game development such as game loop, event handling, and game mechanics. Enroll in ‘ Python for Data Science ’ To learn Python and its effective use in dataanalysis, analytics, machine learning, and data science. 3.
Predictive modeling is a mathematical process that focuses on utilizing historical and current data to predict future outcomes. By identifying patterns within the data, it helps organizations anticipate trends or events, making it a vital component of predictive analytics.
Summary: DataAnalysis and interpretation work together to extract insights from raw data. Analysis finds patterns, while interpretation explains their meaning in real life. Overcoming challenges like data quality and bias improves accuracy, helping businesses and researchers make data-driven choices with confidence.
A data scientist could analyze sales data, customer surveys, and social media trends to determine the reason. They might find that it’s because of a popular deal or event on Tuesdays. Data Cleaning and Preprocessing Before analyzing data, it often needs a cleanup. It’s like deciphering a secret code.
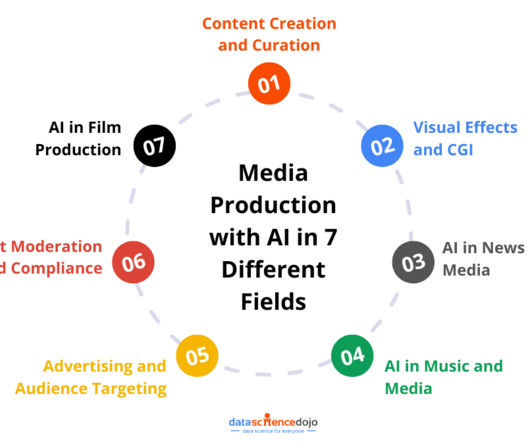
Content Creation and Curation Artificial Intelligence has significantly transformed the landscape of content creation and curation by leveraging its advanced dataanalysis capabilities. Sentiment Analysis Sentiment analysis involves using AI to evaluate the emotions and opinions expressed in news articles.
Oil and gas dataanalysis – Before beginning operations at a well a well, an oil and gas company will collect and process a diverse range of data to identify potential reservoirs, assess risks, and optimize drilling strategies. Consider a financial dataanalysis system. What caused inflation in 2021?
Predictive healthcare analytics refers to the use of advanced data analytics techniques, such as artificial intelligence, machine learning, data mining, and statistical modeling, to forecast future health outcomes based on historical data. This creates a detailed dataset that forms the foundation for analysis.
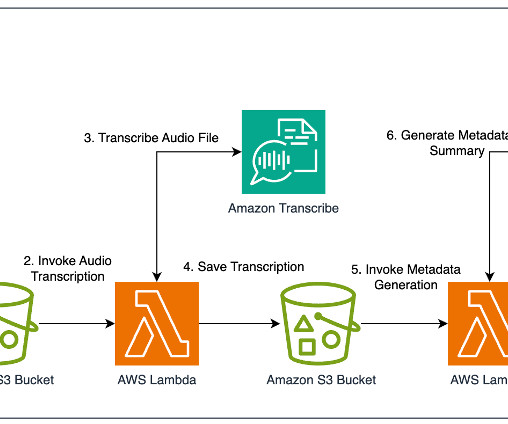
Video dataanalysis with AI wasn’t required for generating detailed, accurate, and high-quality metadata. Generate metadata Now that DPG Media has the transcription of the audio files, they use LLMs through Amazon Bedrock to generate the various categories of metadata (summaries, genre, mood, key events, and so on).
Besides, data analytics solutions contribute to increased cost effectiveness which is proved by the following estimates : businesses with optimized supply chains reduce supply chain expenditures by 15% and make cash-to-cash cycles 3 times faster. Thus, this article explains the role of data analytics in optimizing supply chain logistics.
Financial Analysis: Developing an AI-powered financial analysis tool that uses ChatGPT can provide valuable insights and predictions for businesses. This technology can help investors, financial institutions, and businesses themselves make data-driven decisions based on real-time dataanalysis.
A data scientist could analyze sales data, customer surveys, and social media trends to determine the reason. They might find that it’s because of a popular deal or event on Tuesdays. It’s like the detective’s toolkit, providing the tools to analyze and interpret data.
Data Can Help Healthcare Administrators Make Decisions. Data-driven decision-making in healthcare — the practice of utilizing dataanalysis to inform decisions — is a practice that is steadily gaining popularity among various organizations. Data Can Help Data Management.
This article will guide you through effective strategies to learn Python for Data Science, covering essential resources, libraries, and practical applications to kickstart your journey in this thriving field. Key Takeaways Python’s simplicity makes it ideal for DataAnalysis. in 2022, according to the PYPL Index.
Today, we embark on a nostalgic journey to one of the most captivating and chaotic events in the annals of internet history: Reddit’s infamous “r/place.” Keep reading and learn everything you need to know about this year’s event. Are you ready for the Reddit r/place 2023 and take your place in the Pixel War?
There is no denying that virtual conferences have become the new normal in the world of data science and AI, thanks to the pandemic’s impact. However, it has also opened up new possibilities for connecting and engaging with people from around the world who may not have been able to attend in-person events.
DataAnalysis: dataanalysis is the process of examining, transforming, and arranging raw data in a specific way to generate useful information from the data. dataanalysis uses past events to analyze past results in any context.
With such platforms, powered by AI and dataanalysis techniques, insurance companies are slowly changing the way they function, bidding farewell to the pre-set traditional insurance schemes for people to choose from. This allows them to understand their customers through efficient dataanalysis truly.
Probability distributions: Probability distributions serve as foundational concepts in statistics and mathematics, providing a structured framework for characterizing the probabilities of various outcomes in random events.
We organize all of the trending information in your field so you don't have to. Join 17,000+ users and stay up to date on the latest articles your peers are reading.
You know about us, now we want to get to know you!
Let's personalize your content
Let's get even more personalized
We recognize your account from another site in our network, please click 'Send Email' below to continue with verifying your account and setting a password.


Let's personalize your content