This site uses cookies to improve your experience. To help us insure we adhere to various privacy regulations, please select your country/region of residence. If you do not select a country, we will assume you are from the United States. Select your Cookie Settings or view our Privacy Policy and Terms of Use.
Cookie Settings
Cookies and similar technologies are used on this website for proper function of the website, for tracking performance analytics and for marketing purposes. We and some of our third-party providers may use cookie data for various purposes. Please review the cookie settings below and choose your preference.
Used for the proper function of the website
Used for monitoring website traffic and interactions
Cookie Settings
Cookies and similar technologies are used on this website for proper function of the website, for tracking performance analytics and for marketing purposes. We and some of our third-party providers may use cookie data for various purposes. Please review the cookie settings below and choose your preference.
Strictly Necessary: Used for the proper function of the website
Performance/Analytics: Used for monitoring website traffic and interactions
Support Vector Machines (SVM): This algorithm finds a hyperplane that best separates data points of different classes in high-dimensional space. Decision Trees: These work by asking a series of yes/no questions based on data features to classify data points. Balancing these trade-offs is essential.
Oil and gas dataanalysis – Before beginning operations at a well a well, an oil and gas company will collect and process a diverse range of data to identify potential reservoirs, assess risks, and optimize drilling strategies. Consider a financial dataanalysis system. What caused inflation in 2021?
Without this library, dataanalysis wouldn’t be the same without pandas, which reign supreme with its powerful data structures and manipulation tools. Pandas provides a fast and efficient way to work with tabular data. It is widely used in data science, finance, and other fields where dataanalysis is essential.
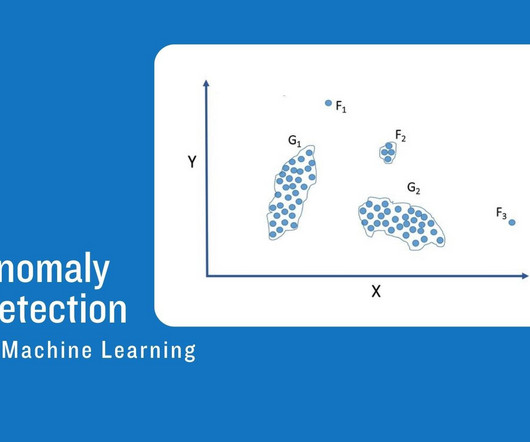
As organizations collect larger data sets with potential insights into business activity, detecting anomalous data, or outliers in these data sets, is essential in discovering inefficiencies, rare events, the root cause of issues, or opportunities for operational improvements.
Anomaly Detection in Machine Learning: An approach to dataanalysis and Machine Learning called “anomaly detection,” also referred to as “outlier detection,” focuses on finding data points or patterns that considerably differ from what is considered to be “normal” or anticipated behaviour.
At events, our teams now approach customer interactions armed with comprehensive, up-to-date information on demand. To maintain the integrity of our core data, we do not retain or use the prompts or the resulting account summary for model training.
Data Cleaning: Raw data often contains errors, inconsistencies, and missing values. Data cleaning identifies and addresses these issues to ensure data quality and integrity. Data Visualisation: Effective communication of insights is crucial in Data Science.
Anomaly detection ( Figure 2 ) is a critical technique in dataanalysis used to identify data points, events, or observations that deviate significantly from the norm. Similarly, autoencoders can be trained to reconstruct input data, and data points with high reconstruction errors can be flagged as anomalies.
The following Venn diagram depicts the difference between data science and data analytics clearly: 3. Dataanalysis can not be done on a whole volume of data at a time especially when it involves larger datasets. The K-NearestNeighbor Algorithm is a good example of an algorithm with low bias and high variance.
Heart disease stands as one of the foremost global causes of mortality today, presenting a critical challenge in clinical dataanalysis. Leveraging hybrid machine learning techniques, a field highly effective at processing vast healthcare data volumes is increasingly promising in effective heart disease prediction.
Causal AI is revolutionizing how we understand the interconnectedness of variables in our data-driven world. It bridges the gap between mere correlation and genuine insight, enabling organizations to make informed decisions based on the root causes of events.
We organize all of the trending information in your field so you don't have to. Join 17,000+ users and stay up to date on the latest articles your peers are reading.
You know about us, now we want to get to know you!
Let's personalize your content
Let's get even more personalized
We recognize your account from another site in our network, please click 'Send Email' below to continue with verifying your account and setting a password.


Let's personalize your content