This site uses cookies to improve your experience. To help us insure we adhere to various privacy regulations, please select your country/region of residence. If you do not select a country, we will assume you are from the United States. Select your Cookie Settings or view our Privacy Policy and Terms of Use.
Cookie Settings
Cookies and similar technologies are used on this website for proper function of the website, for tracking performance analytics and for marketing purposes. We and some of our third-party providers may use cookie data for various purposes. Please review the cookie settings below and choose your preference.
Used for the proper function of the website
Used for monitoring website traffic and interactions
Cookie Settings
Cookies and similar technologies are used on this website for proper function of the website, for tracking performance analytics and for marketing purposes. We and some of our third-party providers may use cookie data for various purposes. Please review the cookie settings below and choose your preference.
Strictly Necessary: Used for the proper function of the website
Performance/Analytics: Used for monitoring website traffic and interactions
Get ahead in dataanalysis with our summary of the top 7 must-know statistical techniques. Top statistical techniques – Data Science Dojo Counterfactual causal inference: Counterfactual causal inference is a statistical technique that is used to evaluate the causal significance of historical events.
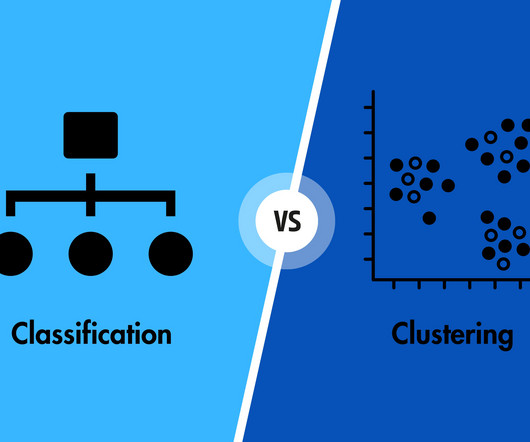
Common Classification Algorithms: Logistic Regression: A popular choice for binary classification, it uses a mathematical function to model the probability of a data point belonging to a particular class. Decision Trees: These work by asking a series of yes/no questions based on data features to classify data points.
Here are some ways AI enhances IoT devices: Advanced dataanalysis AI algorithms can process and analyze vast volumes of IoT-generated data. By leveraging techniques like machine learning and deep learning, IoT devices can identify trends, anomalies, and patterns within the data.
First, a robust data platform (such as a customer data platform; CDP) that can integrate data from various sources, such as tracking systems, ERP systems, e-commerce platforms to effectively perform data analytics. In contrast, multi-touch attribution leverages individual user-level data from various channels.
Tailoring the algorithm to the specific data type and application enhances performance and interpretability, facilitating clear communication and informed decision-making. – Supervised Classification: Requires labeled training data. – Algorithms: SupportVectorMachines (SVM), Random Forest, Neural Networks.
Without this library, dataanalysis wouldn’t be the same without pandas, which reign supreme with its powerful data structures and manipulation tools. Pandas provides a fast and efficient way to work with tabular data. It is widely used in data science, finance, and other fields where dataanalysis is essential.
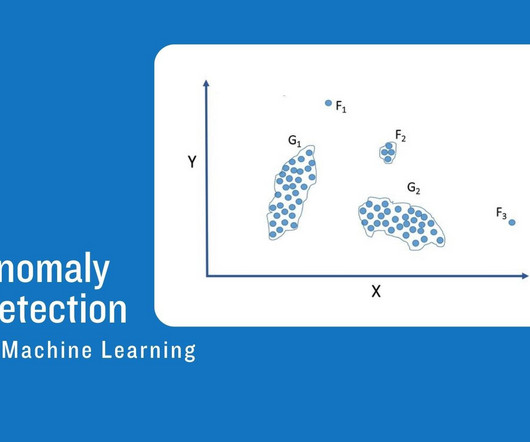
As organizations collect larger data sets with potential insights into business activity, detecting anomalous data, or outliers in these data sets, is essential in discovering inefficiencies, rare events, the root cause of issues, or opportunities for operational improvements.
In a typical MLOps project, similar scheduling is essential to handle new data and track model performance continuously. Load and Explore Data We load the Telco Customer Churn dataset and perform exploratory dataanalysis (EDA). SupportVectorMachine (svm): Versatile model for linear and non-linear data.
In case you need to determine the likelihood of an event occurring, the application of sigmoid function is important. Therefore, the result of this supposition evaluates that it does not perform quite well with complicated data. Hyperplanes are useful in separating the data points into groups.
I will start by looking at the data distribution, followed by the relationship between the target variable and independent variables. #replacing the missing values with the mean variables = ['Glucose','BloodPressure','SkinThickness','Insulin','BMI'] for i in variables: df[i].replace(0,df[i].mean(),inplace=True)
Summary: Statistical Modeling is essential for DataAnalysis, helping organisations predict outcomes and understand relationships between variables. Introduction Statistical Modeling is crucial for analysing data, identifying patterns, and making informed decisions. Model selection requires balancing simplicity and performance.
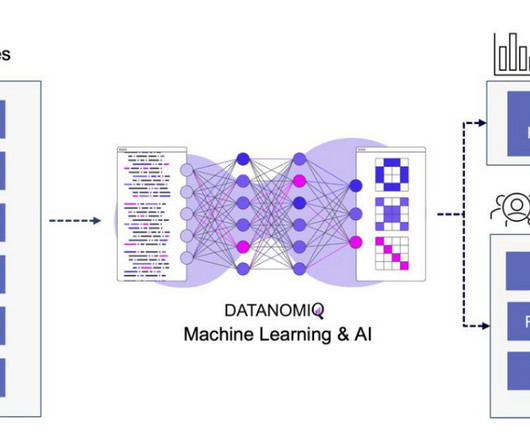
Image from "Big Data Analytics Methods" by Peter Ghavami Here are some critical contributions of data scientists and machine learning engineers in health informatics: DataAnalysis and Visualization: Data scientists and machine learning engineers are skilled in analyzing large, complex healthcare datasets.
49% of companies in the world that use Machine Learning and AI in their marketing and sales processes apply it to identify the prospects of sales. Observations that deviate from the majority of the data are known as anomalies and might take the shape of occurrences, trends, or events that differ from customary or expected behaviour.
It could be anything from customer service to dataanalysis. Collect data: Gather the necessary data that will be used to train the AI system. This data should be relevant, accurate, and comprehensive. Several algorithms are available, including decision trees, neural networks, and supportvectormachines.
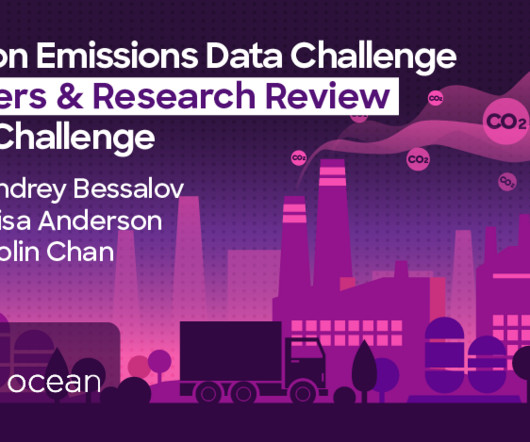
Some of the most serious effects of global warming include rising sea levels, more extreme weather events, changes in animal and plant life, and soil health & erosion. Here we use data science to diagnose the issues and propose better practices to treat our planet better than the last 30 years.
The field demands a unique combination of computational skills and biological knowledge, making it a perfect match for individuals with a data science and machine learning background.
Text categorization is supported by a number of programming languages, including R, Python, and Weka, but the main focus of this article will be text classification with R. R Language Source: i2tutorial R, a popular open-source programming language, is used for statistical computation and dataanalysis.
Data Cleaning: Raw data often contains errors, inconsistencies, and missing values. Data cleaning identifies and addresses these issues to ensure data quality and integrity. Data Visualisation: Effective communication of insights is crucial in Data Science.
The following Venn diagram depicts the difference between data science and data analytics clearly: 3. Dataanalysis can not be done on a whole volume of data at a time especially when it involves larger datasets. Another example can be the algorithm of a supportvectormachine.
Anomaly detection ( Figure 2 ) is a critical technique in dataanalysis used to identify data points, events, or observations that deviate significantly from the norm. Supervised Learning These methods require labeled data to train the model. The model learns to distinguish between normal and abnormal data points.
So how can the technology of our time, machine learning, be used to improve the quality and length of human life? Heart disease stands as one of the foremost global causes of mortality today, presenting a critical challenge in clinical dataanalysis. Dealing with missing values is a common challenge in medical dataanalysis.
By visualizing decision paths, these algorithms offer insights into the data, enabling straightforward decision-making. A decision tree is a flowchart-like model that represents decisions and their possible consequences, including chance event outcomes, resource costs, and utility. What is a decision tree?
We organize all of the trending information in your field so you don't have to. Join 17,000+ users and stay up to date on the latest articles your peers are reading.
You know about us, now we want to get to know you!
Let's personalize your content
Let's get even more personalized
We recognize your account from another site in our network, please click 'Send Email' below to continue with verifying your account and setting a password.


Let's personalize your content