This site uses cookies to improve your experience. To help us insure we adhere to various privacy regulations, please select your country/region of residence. If you do not select a country, we will assume you are from the United States. Select your Cookie Settings or view our Privacy Policy and Terms of Use.
Cookie Settings
Cookies and similar technologies are used on this website for proper function of the website, for tracking performance analytics and for marketing purposes. We and some of our third-party providers may use cookie data for various purposes. Please review the cookie settings below and choose your preference.
Used for the proper function of the website
Used for monitoring website traffic and interactions
Cookie Settings
Cookies and similar technologies are used on this website for proper function of the website, for tracking performance analytics and for marketing purposes. We and some of our third-party providers may use cookie data for various purposes. Please review the cookie settings below and choose your preference.
Strictly Necessary: Used for the proper function of the website
Performance/Analytics: Used for monitoring website traffic and interactions
For instance, Berkeley’s Division of Data Science and Information points out that entry level data science jobs remote in healthcare involves skills in NLP (Natural Language Processing) for patient and genomic dataanalysis, whereas remote data science jobs in finance leans more on skills in risk modeling and quantitative analysis.
Britt Staniar Senior Community Program Manager, Recognition Programs Catherine Gosparini Senior Community Program Manager, Developer Program Sarah Molina January 18, 2023 - 8:24pm January 19, 2023 Tableau Ambassadors teach and share while fostering a positive and supportive space within the data community. Registration is now open!
Drumroll, please: Nominations and applications for the 2021 Tableau Ambassador Program are now open! The incalculable impact of the 2020 Tableau Ambassadors. No dataanalysis could ever fully quantify the difficulty of the previous year, nor how the 2020 ambassadors rallied to the occasion. Britt Staniar. Ateken Abla.
Britt Staniar Senior Community Program Manager, Recognition Programs Brittni McCafferty Community Global Program Manager – User Groups Sarah Molina March 3, 2023 - 9:04pm March 4, 2023 Tableau Ambassadors teach and share while fostering a positive and supportive space within the community. What do Tableau User Group Ambassadors do?
Britt Staniar Senior Community Program Manager, Recognition Programs Catherine Gosparini Senior Community Program Manager, Developer Program Sarah Molina January 18, 2023 - 8:24pm January 19, 2023 Tableau Ambassadors teach and share while fostering a positive and supportive space within the data community. Registration is now open!
A data scientist could analyze sales data, customer surveys, and social media trends to determine the reason. They might find that it’s because of a popular deal or event on Tuesdays. Data Cleaning and Preprocessing Before analyzing data, it often needs a cleanup. It’s like deciphering a secret code.
Britt Staniar Senior Community Program Manager, Recognition Programs Brittni McCafferty Community Global Program Manager – User Groups Sarah Molina March 3, 2023 - 9:04pm March 4, 2023 Tableau Ambassadors teach and share while fostering a positive and supportive space within the community. What do Tableau User Group Ambassadors do?
Gandes Goldestan Business Intelligence Analyst Jabar Digital Service Sarah Molina January 24, 2023 - 8:29pm January 25, 2023 Tableau plays a huge role in helping users get to insights quickly while telling impactful stories using their data. All visualizations were published on Tableau Public.
New big data architectures and, above all, data sharing concepts such as Data Mesh are ideal for creating a common database for many data products and applications. The Event Log Data Model for Process Mining Process Mining as an analytical system can very well be imagined as an iceberg.
Gandes Goldestan Business Intelligence Analyst Jabar Digital Service Sarah Molina January 24, 2023 - 8:29pm January 25, 2023 Tableau plays a huge role in helping users get to insights quickly while telling impactful stories using their data. All visualizations were published on Tableau Public.
Kuber Sharma Director, Product Marketing, Tableau Kristin Adderson August 22, 2023 - 12:11am August 22, 2023 Whether you're a novice data analyst exploring the possibilities of Tableau or a leader with years of experience using VizQL to gain advanced insights—this is your list of key Tableau features you should know, from A to Z.
A data scientist could analyze sales data, customer surveys, and social media trends to determine the reason. They might find that it’s because of a popular deal or event on Tuesdays. It’s like the detective’s toolkit, providing the tools to analyze and interpret data.
Sarah Molina April 3, 2024 - 10:38pm Danika Harrod Marketing Manager, Community Content & Events, Tableau Pata Gogová encountered Tableau for the first time four years ago. “I I was working for a company that wanted to move away from the dataanalysis tool they were using and I was tasked with exploring other options.
Summary: This article explores different types of DataAnalysis, including descriptive, exploratory, inferential, predictive, diagnostic, and prescriptive analysis. Introduction DataAnalysis transforms raw data into valuable insights that drive informed decisions. What is DataAnalysis?
Planning Manager, Tableau. Data analytics now play a growing and crucial role in how sports organizations like Team USA are making decisions and improvements to their programs. Through the process, we learned a lot about each sport, and how data can drive new insights and inform strategic decision-making. Data lessons learned.
Summary: DataAnalysis and interpretation work together to extract insights from raw data. Analysis finds patterns, while interpretation explains their meaning in real life. Overcoming challenges like data quality and bias improves accuracy, helping businesses and researchers make data-driven choices with confidence.
Similarly, the Tableau Server must also be maintained to perform optimally. Tableau Server is one of the products in the Tableau suite, which is hosted and maintained within your company’s firewall and can be deployed on Cloud as well as On-Premises. What is Tableau Server Maintenance and Why Does It Matter?
Drumroll, please: Nominations and applications for the 2021 Tableau Ambassador Program are now open! The incalculable impact of the 2020 Tableau Ambassadors. No dataanalysis could ever fully quantify the difficulty of the previous year, nor how the 2020 ambassadors rallied to the occasion. Britt Staniar. Ateken Abla.
Planning Manager, Tableau. Data analytics now play a growing and crucial role in how sports organizations like Team USA are making decisions and improvements to their programs. Through the process, we learned a lot about each sport, and how data can drive new insights and inform strategic decision-making. Data lessons learned.
Organizations that rely on dataanalysis to make decisions have a significant competitive advantage in overcoming challenges and planning for the future. And yet data access and the skills required to understand the data are, in many organizations, restricted to business intelligence teams and IT specialists. “It
Even within Tableau, an organization focused on analytics, we have our fair share of governance problems—and they’re not unlike what our customers can experience every day. . With a holistic approach to data governance, you can get to the root of common problems, rather than chasing one-off issues. Data architecture.
Even within Tableau, an organization focused on analytics, we have our fair share of governance problems—and they’re not unlike what our customers can experience every day. . With a holistic approach to data governance, you can get to the root of common problems, rather than chasing one-off issues. Data architecture.
VP Solution Engineering, Tableau. We know that data-driven businesses are more resilient and more confident. To enable transformation across the business, Chief Information Officers (CIO) need to tell memorable data stories to the board and to the business, says Juha Teljo, Tableau VP of Solution Engineering.
Here’s a list of key skills that are typically covered in a good data science bootcamp: Programming Languages : Python : Widely used for its simplicity and extensive libraries for dataanalysis and machine learning. R : Often used for statistical analysis and data visualization.
Ateken Abla April 3, 2024 - 10:38pm Danika Harrod Marketing Manager, Community Content & Events, Tableau Chris Westlake fell in love with Tableau from the get-go. “I It was the fun crossover between data and creativity that I didn’t even realize I was looking for. I love Tableau User Groups!
Instead, they’ll turn to big data technology to help them work through and analyze this data. Some of these new tools use AI to predict events more accurately by employing predictive analytics to identify subtle relationships between even seemingly unrelated variables. Predictive Business Analytics.
BI involves using data mining, reporting, and querying techniques to identify key business metrics and KPIs that can help companies make informed decisions. A career path in BI can be a lucrative and rewarding choice for those with interest in dataanalysis and problem-solving. How to become a blockchain maestro?
BI involves using data mining, reporting, and querying techniques to identify key business metrics and KPIs that can help companies make informed decisions. A career path in BI can be a lucrative and rewarding choice for those with interest in dataanalysis and problem-solving. How to become a blockchain maestro?
Summary: Descriptive Analytics tools transform historical data into visual reports, helping businesses identify trends and improve decision-making. Popular tools like Power BI, Tableau, and Google Data Studio offer unique features for DataAnalysis. What is Descriptive Analytics?
You will be listening to the requirements of the clients, combining this with the data, and matching them up with the most appropriate solutions. Business analysts are concerned with looking at data and events, making sure negative events do not occur again and choosing and implementing solutions to ensure that this is the case.
Organizations that rely on dataanalysis to make decisions have a significant competitive advantage in overcoming challenges and planning for the future. And yet data access and the skills required to understand the data are, in many organizations, restricted to business intelligence teams and IT specialists. “It
If your dataset is not in time order (time consistency is required for accurate Time Series projects), DataRobot can fix those gaps using the DataRobot Data Prep tool , a no-code tool that will get your data ready for Time Series forecasting. Prepare your data for Time Series Forecasting. Perform exploratory dataanalysis.
So let’s take a look at some of the free data visualization tools available, and how they can provide actionable insights that allow for driving informed decision-making and strategic planning while keeping to being user friendly. What sets Tableau apart is its intuitive, user-friendly, drag-and-drop interface.
Skilled personnel are necessary for accurate DataAnalysis. Pricing Analytics is the practice of using DataAnalysis techniques to determine the most effective pricing strategies for products or services. Executive alignment is crucial for successful pricing initiatives. What is Pricing Analytics?
Whether collected from primary sources like surveys and interviews or secondary sources such as databases and research reports, data collection is critical in providing insights for various purposes, including business strategy, scientific research, and social studies. Observational data can be either participant or non-participant.
Overview: Data science vs data analytics Think of data science as the overarching umbrella that covers a wide range of tasks performed to find patterns in large datasets, structure data for use, train machine learning models and develop artificial intelligence (AI) applications.
It’s a powerful dataanalysis tool that has changed how companies handle data analytics for years, even with its higher price. The complexity of their geospatial dataanalysis underscored the necessity for a scalable and efficient reporting solution, replacing a slow and risky manual process.
VP Solution Engineering, Tableau. We know that data-driven businesses are more resilient and more confident. To enable transformation across the business, Chief Information Officers (CIO) need to tell memorable data stories to the board and to the business, says Juha Teljo, Tableau VP of Solution Engineering.
If your business relied on a hard-and-fast rule, or a predictable sequence of events, someone was bound to write code to do the work and throw that on a few dozen servers to scale it out. Companies will still need advanced ML modeling and data viz, sure. In fact, just about all of the data work is best suited for the advanced folks.
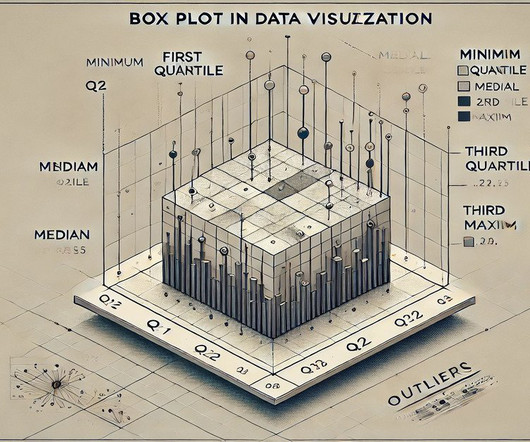
Summary: A Box Plot is a graphical representation summarising data distribution through key statistics like quartiles and outliers. It visualises central tendencies and variability, making it invaluable for DataAnalysis. Modified Box Plots Sometimes, modified Box Plots are used to handle data with extreme outliers.
With the proper DataAnalysis, businesses can reduce costs, increase profits, and provide better services. Types of Data Analytics Data Analytics includes different types, each serving a unique purpose. These types help businesses analyse data in various ways to solve problems and improve strategies.
Summary: Leveraging data skills for Financial Analysts explores how Financial Analysts can harness data skills to enhance their roles. It delves into dataanalysis techniques to interpret financial trends effectively, including statistical analysis and data visualization.
Diagnostic Analytics Diagnostic analytics goes a step further by explaining why certain events occurred. It uses data mining , correlations, and statistical analyses to investigate the causes behind past outcomes. Such insights enable businesses to replicate successful strategies and avoid past mistakes, thereby optimising performance.
This article explores the rich landscape of time series analysis in machine learning, focusing on how Comet, a powerful machine learning experiment management platform, can enhance the process. What is Time Series Analysis? In essence, it deals with sequences of data ordered chronologically.
We organize all of the trending information in your field so you don't have to. Join 17,000+ users and stay up to date on the latest articles your peers are reading.
You know about us, now we want to get to know you!
Let's personalize your content
Let's get even more personalized
We recognize your account from another site in our network, please click 'Send Email' below to continue with verifying your account and setting a password.


Let's personalize your content