This site uses cookies to improve your experience. To help us insure we adhere to various privacy regulations, please select your country/region of residence. If you do not select a country, we will assume you are from the United States. Select your Cookie Settings or view our Privacy Policy and Terms of Use.
Cookie Settings
Cookies and similar technologies are used on this website for proper function of the website, for tracking performance analytics and for marketing purposes. We and some of our third-party providers may use cookie data for various purposes. Please review the cookie settings below and choose your preference.
Used for the proper function of the website
Used for monitoring website traffic and interactions
Cookie Settings
Cookies and similar technologies are used on this website for proper function of the website, for tracking performance analytics and for marketing purposes. We and some of our third-party providers may use cookie data for various purposes. Please review the cookie settings below and choose your preference.
Strictly Necessary: Used for the proper function of the website
Performance/Analytics: Used for monitoring website traffic and interactions
ArticleVideo Book This article discusses Machine Learning in Geographic Information System GIS, in other words, Machine Learning for spatial dataanalysis. The post Introducing Machine Learning for Spatial DataAnalysis appeared first on Analytics Vidhya. Usually, we can.
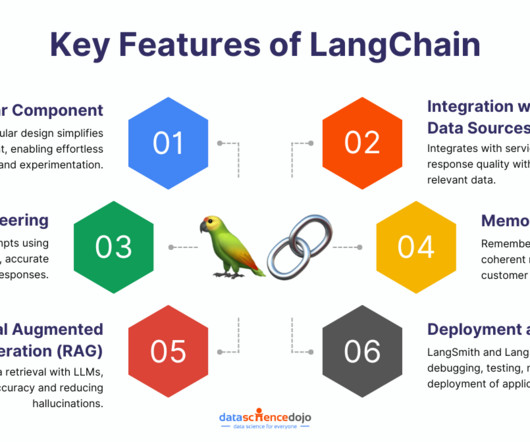
Introduction In today’s world, businesses and organizations rely heavily on data to make informed decisions. However, analyzing large amounts of data can be a time-consuming and daunting task. With the help of frameworks like Langchain and Gen AI, you can automate your dataanalysis and save valuable time.
In this blog, we will discuss exploratory dataanalysis, also known as EDA, and why it is important. We will also be sharing code snippets so you can try out different analysis techniques yourself. EDA is an iterative process of conglomerative activities which include data cleaning, manipulation and visualization.
Dataanalysis is an essential process in today’s world of business and science. It involves extracting insights from large sets of data to make informed decisions. One of the most common ways to represent a dataanalysis is through code. However, is code the best way to represent a dataanalysis?
Introduction We will be analyzing fitness information in this article completely in Excel. Excel has some inbuilt functions which we could use to make our analysis stand out. About the DataAnalysis The data is publicly available on Kaggle. It includes fitness information collected by the contributor […].
They skilfully transmute raw, overwhelming data into golden insights, driving powerful marketing strategies. And that, dear friends, is what we’re delving into today – the captivating world of dataanalysis in marketing. Dataanalysis in marketing is like decoding a treasure map. And guess what?
Introduction Exploratory DataAnalysis helps in identifying any outlier data points, understanding the relationships between the various attributes and structure of the data, recognizing the important variables. It helps in framing questions and visualizing the results, paving the way to make an informed choice […].
One of the most promising areas within AI in healthcare is Natural Language Processing (NLP), which has the potential to revolutionize patient care by facilitating more efficient and accurate dataanalysis and communication.
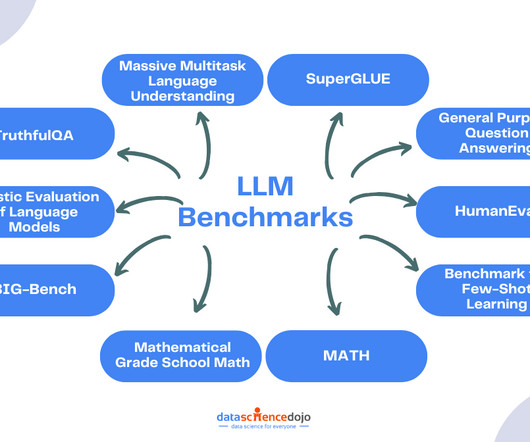
For tasks like classification and question-answering, F1-Score , Precision , and Recall ensure relevant information is captured with minimal errors. This benchmark evaluates the versatility and adaptability of a model in handling diverse question types, making it essential for applications in customer support and information retrieval.
Get ahead in dataanalysis with our summary of the top 7 must-know statistical techniques. Adaptive decision analysis: Adaptive Decision Analysis is a statistical technique that is used to make decisions under uncertainty. Master these tools for better insights and results.
Handling missing data is one of the most common challenges in dataanalysis and machine learning. Missing values can arise for various reasons, such as errors in data collection, manual omissions, or even the natural absence of information.
Introduction Imagine you’re working on a dataset to build a Machine Learning model and don’t want to spend too much effort on exploratory dataanalysis codes. You may sometimes find it confusing to sort, filter, or group data to obtain the required information.
DataAnalysis Expressions (DAX) is a language used in Analysis Services, Power BI, and Power Pivot in Excel. The Basics of DAX for DataAnalysis DAX is a powerful language that can be used to create dynamic and informative reports that can help you make better decisions.
DataAnalysis Expressions (DAX) is a language used in Analysis Services, Power BI, and Power Pivot in Excel. The Basics of DAX for DataAnalysis DAX is a powerful language that can be used to create dynamic and informative reports that can help you make better decisions.
The amount of data that businesses collect is growing exponentially, and the types of data that businesses collect are becoming more diverse. This growing complexity of business data is making it more difficult for businesses to make informed decisions. Top 10 AI tools for dataanalysis AI Tools for DataAnalysis 1.
That’s akin to the experience of sifting through today’s digital news landscape, except instead of a magical test, we have the power of dataanalysis to help us find the news that matters most to us.
This article was published as a part of the Data Science Blogathon What is Hypothesis Testing? Any data science project starts with exploring the data. When we perform an analysis on a sample through exploratory dataanalysis and inferential statistics we get information about the sample.
An overview of dataanalysis, the dataanalysis process, its various methods, and implications for modern corporations. Studies show that 73% of corporate executives believe that companies failing to use dataanalysis on big data lack long-term sustainability.
Are you tired of spending endless hours searching for specific information in large Excel files? Luckily, Excel’s VLOOKUP tool comes to the rescue, making data discovery much easier. Whether you’re a seasoned Excel user or a beginner, mastering VLOOKUP can greatly enhance your dataanalysis skills.
This article was published as a part of the Data Science Blogathon. Introduction Data mining is extracting relevant information from a large corpus of natural language. Large data sets are sorted through data mining to find patterns and relationships that may be used in dataanalysis to assist solve business challenges.
"The main issue is that many PDFs are simply pictures of information, which means you need Optical Character Recognition software to turn those pictures into data, especially when the original is old or includes handwriting."
In today’s fast-paced business landscape, making informed decisions is essential for the success of organizations. Both MS Excel and Power BI offer impressive capabilities regarding dataanalysis and decision-making. However, determining the best choice depends on specific requirements.
Enter the ROUND function in Microsoft Excel—a versatile tool transforming numerical data into precise, readable, and professional results. appeared first on Analytics Vidhya.
By leveraging these charts, users can enhance DataAnalysis, reveal critical insights, and support data-driven decisions, transforming Excel into a powerful visualisation tool for complex data. Introduction Microsoft Excel is a powerful tool for data visualisation. Why Use Advanced Excel Charts in DataAnalysis?
Summary: Online Analytical Processing (OLAP) systems in Data Warehouse enable complex DataAnalysis by organizing information into multidimensional structures. Key characteristics include fast query performance, interactive analysis, hierarchical data organization, and support for multiple users.
This article was published as a part of the Data Science Blogathon image source: Author The Importance of Data Visualization A huge amount of data is being generated every instant due to business activities in globalization. Exploratory Dataanalysis can help […].
Imagine diving into the details of dataanalysis, predictive modeling, and ML. Envision yourself unraveling the insights and patterns for making informed decisions that shape the future. The concept of Data Science was first used at the start of the 21st century, making it a relatively new area of research and technology.
Everything we speak, write carries a huge amount of information. The topic name of the article, tone of the article everything adds a piece of information that we can interpret and extract the insights from them. Processing text and extracting the important information from the text is text processing.
Look no further than Data Science Dojo’s Introduction to Python for Data Science course. This instructor-led live training course is designed for individuals who want to learn how to use Python to perform dataanalysis, visualization, and manipulation.
Introduction Data visualization is an essential aspect of dataanalysis, as it allows us to understand and interpret complex information more easily. One popular type of visualization is the dot plot, which effectively displays categorical data and numerical values.
As businesses expand their operations globally, collecting and analyzing vast amounts of information has become more critical than ever before. However, this increased reliance on data also exposes organizations to elevated risks of cyber threats and attacks aimed at stealing or corrupting valuable information.
Whether it’s finance, healthcare, or tech, each sector has unique data requirements. Database Analyst Description Database Analysts focus on managing, analyzing, and optimizing data to support decision-making processes within an organization. You could apply your skills in industries like finance, healthcare, and even fashion.
A wide range of applications deals with a variety of tasks, ranging from writing, E-learning, and SEO to medical advice, marketing, dataanalysis, and so much more. However, our focus lies on exploring the GPTs for data science available on the platform. You can upload your data files to this GPT that it can then analyze.
Introduction In the realm of dataanalysis, where the ability to extract actionable insights from information is paramount, your resume assumes a pivotal role. Your Data Analyst resume is your […] The post How to Create a Data Analyst Resume That Will Get You Hired?
Experts in the field teach these concepts, giving you the assurance of receiving the latest information. LLM for real-world Applications Custom LLMs are trained on your specific data. For example, you could train a custom LLM on your customer data to improve your customer service experience.
Consequently, it requires solid knowledge of the field, either earned through experience or through the best data science course, fostering a more dynamic and responsive approach to dataanalysis, paving the way for innovations and advancements in various fields that rely heavily on data-driven insights.
In a world where data is rapidly generated and accumulated, the ability to distill important features from a vast array of variables can significantly enhance the efficiency and effectiveness of dataanalysis and machine learning models. What is dimensionality reduction?
Data visualization is an essential tool in the modern landscape of information management, turning complex data into accessible visuals that can facilitate clearer understanding. With the exponential growth of data, the need to effectively interpret vast amounts of information has never been more critical.
It supports large, multi-dimensional arrays and matrices of numerical data, as well as a large library of mathematical functions to operate on these arrays. The package is particularly useful for performing mathematical operations on large datasets and is widely used in machine learning, dataanalysis, and scientific computing.
From data discovery and cleaning to report creation and sharing, we will delve into the key steps that can be taken to turn data into decisions. A data analyst is a professional who uses data to inform business decisions.
By analyzing diverse data sources and incorporating advanced machine learning algorithms, LLMs enable more informed decision-making, minimizing potential risks. These AI-powered models assist clients in making well-informed decisions and enhance the overall quality of financial advice.
Data visualization is the art of presenting complex information in a way that is easy to understand and analyze. With the explosion of data in today’s business world, the ability to create compelling data visualizations has become a critical skill for anyone working with data.
Applications powered by large language models (LLMs) are revolutionizing the way businesses operate, from automating customer service to enhancing dataanalysis. It will ensure seamless integration of the business’s internal knowledge base and external data sources.
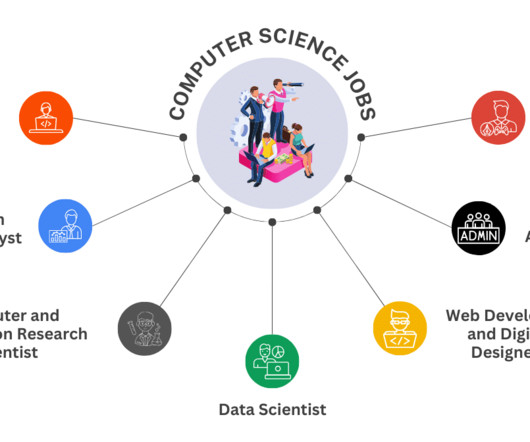
According to the Bureau of Labor Statistics , the outlook for information technology and computer science jobs is projected to grow by 15 percent between 2021 and 2031, a rate much faster than the average for all occupations. They implement security measures to safeguard sensitive data and prevent cyberattacks. According to the U.S.
We organize all of the trending information in your field so you don't have to. Join 17,000+ users and stay up to date on the latest articles your peers are reading.
You know about us, now we want to get to know you!
Let's personalize your content
Let's get even more personalized
We recognize your account from another site in our network, please click 'Send Email' below to continue with verifying your account and setting a password.


Let's personalize your content