This site uses cookies to improve your experience. To help us insure we adhere to various privacy regulations, please select your country/region of residence. If you do not select a country, we will assume you are from the United States. Select your Cookie Settings or view our Privacy Policy and Terms of Use.
Cookie Settings
Cookies and similar technologies are used on this website for proper function of the website, for tracking performance analytics and for marketing purposes. We and some of our third-party providers may use cookie data for various purposes. Please review the cookie settings below and choose your preference.
Used for the proper function of the website
Used for monitoring website traffic and interactions
Cookie Settings
Cookies and similar technologies are used on this website for proper function of the website, for tracking performance analytics and for marketing purposes. We and some of our third-party providers may use cookie data for various purposes. Please review the cookie settings below and choose your preference.
Strictly Necessary: Used for the proper function of the website
Performance/Analytics: Used for monitoring website traffic and interactions
The SQL language, or Structured Query Language, is essential for managing and manipulating relational databases. It has become indispensable for those working with data across various industries. Introduction to SQL language SQL language stands for Structured Query Language. Why learn SQL language?
Join the data revolution and secure a competitive edge for businesses vying for supremacy. Data Scientists and Analysts use various tools such as machine learning algorithms, statistical modeling, natural language processing (NLP), and predictiveanalytics to identify trends, uncover opportunities for improvement, and make better decisions.
The lower part of the iceberg is barely visible to the normal analyst on the tool interface, but is essential for implementation and success: this is the Event Log as the data basis for graph and dataanalysis in Process Mining. The creation of this data model requires the data connection to the source system (e.g.
Data science involves the use of scientific methods, processes, algorithms, and systems to analyze and interpret data. It integrates aspects from multiple disciplines, including: Statistics : For dataanalysis and interpretation. Business Acumen : To translate data insights into actionable business strategies.
Data science involves the use of scientific methods, processes, algorithms, and systems to analyze and interpret data. It integrates aspects from multiple disciplines, including: Statistics : For dataanalysis and interpretation. Business Acumen : To translate data insights into actionable business strategies.
Being able to discover connections between variables and to make quick insights will allow any practitioner to make the most out of the data. Analytics and DataAnalysis Coming in as the 4th most sought-after skill is dataanalytics, as many data scientists will be expected to do some analysis in their careers.
Summary: Power BI alternatives like Tableau, Qlik Sense, and Zoho Analytics provide businesses with tailored DataAnalysis and Visualisation solutions. Selecting the right alternative ensures efficient data-driven decision-making and aligns with your organisation’s goals and budget.
Overview: Data science vs dataanalytics Think of data science as the overarching umbrella that covers a wide range of tasks performed to find patterns in large datasets, structure data for use, train machine learning models and develop artificial intelligence (AI) applications.
Summary: The blog delves into the 2024 Data Analyst career landscape, focusing on critical skills like Data Visualisation and statistical analysis. It identifies emerging roles, such as AI Ethicist and Healthcare Data Analyst, reflecting the diverse applications of DataAnalysis.
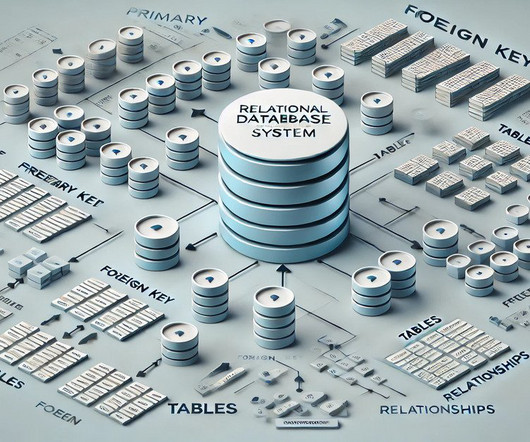
Summary: Relational Database Management Systems (RDBMS) are the backbone of structured data management, organising information in tables and ensuring data integrity. This article explores RDBMS’s features, advantages, applications across industries, the role of SQL, and emerging trends shaping the future of data management.
Here are steps you can follow to pursue a career as a BI Developer: Acquire a solid foundation in data and analytics: Start by building a strong understanding of data concepts, relational databases, SQL (Structured Query Language), and data modeling.
Alteryx’s Capabilities Data Blending: Effortlessly combine data from multiple sources. PredictiveAnalytics: Leverage machine learning algorithms for accurate predictions. This makes Alteryx an indispensable tool for businesses aiming to glean insights and steer their decisions based on robust data.
Summary: Descriptive Analytics tools transform historical data into visual reports, helping businesses identify trends and improve decision-making. Popular tools like Power BI, Tableau, and Google Data Studio offer unique features for DataAnalysis. What is Descriptive Analytics?
The main goal of DataAnalytics is to improve decision-making. With the proper DataAnalysis, businesses can reduce costs, increase profits, and provide better services. For example, a weather app predicts rainfall using past climate data. Data Analysts , however, do not need deep programming knowledge.
A Data Scientist requires to be able to visualize quickly the data before creating the model and Tableau is helpful for that. Tableau is useful for summarising the metrics of success. Disadvantages of Tableau for Data Science However, apart from the advantages, Tableau for Data Science also has its own disadvantages.
Summary: Operations Analyst job in 2025 are integral to improving efficiency, dataanalysis, and process optimisation. With career growth opportunities and a focus on data-driven decisions, this job remains central to organisational success. Expertise in tools like Power BI, SQL, and Python is crucial.
In the realm of Data Intelligence, the blog demystifies its significance, components, and distinctions from Data Information, Artificial Intelligence, and DataAnalysis. Key Components of Data Intelligence In Data Intelligence, understanding its core components is like deciphering the secret language of information.
How Churn is Analyzed and Monitored Churn analytics involves using dataanalysis techniques to understand and predict customer churn. Various methods include: Descriptive Analytics : Summarizing historical data helps understand the current churn state. days, account_tenure_median = 5.01
Key Takeaways Pickl.AI’s Data Science Job Guarantee Program offers an online comprehensive curriculum and practical training. With a 1-year job guarantee, it focuses on essential skills like Python, Tableau, SQL, and machine learning. Data Mining : Think of data mining as digging for gold in a mountain of data.
Understanding Data Science Data Science is a multidisciplinary field that combines statistics, mathematics, computer science, and domain-specific knowledge to extract insights and wisdom from structured and unstructured data. Data Science has been critical in providing insights and solutions based on DataAnalysis.
Machine learning can then “learn” from the data to create insights that improve performance or inform predictions. Just as humans can learn through experience rather than merely following instructions, machines can learn by applying tools to dataanalysis.
Spark SQL Spark SQL is a module that works with structured and semi-structured data. It allows users to run SQL queries, read data from different sources, and seamlessly integrate with Spark’s core capabilities. This component bridges the gap between traditional SQL databases and big data processing.
ThoughtSpot is a cloud-based AI-powered analytics platform that uses natural language processing (NLP) or natural language query (NLQ) to quickly query results and generate visualizations without the user needing to know any SQL or table relations. Why Use ThoughtSpot?
Effective data modeling enhances the usability of the BI system by making it easier to navigate through complex datasets. DataAnalysis At this stage, organizations use various analytical techniques to derive insights from the stored data: Descriptive Analytics: Provides insights into past performance by summarizing historical data.
Power BI is a dynamic business intelligence and analytics platform that transforms raw data into actionable insights through powerful visualisations and reports. Developed by Microsoft, it is designed to simplify DataAnalysis for users at all levels, from beginners to advanced analysts.
Natural Language Processing (NLP) for Data Interaction Generative AI models like GPT-4 utilize transformer architectures to understand and generate human-like text based on a given context. This capability automates much of the manual work traditionally involved in dataanalytics.
A key aspect of this evolution is the increased adoption of cloud computing, which allows businesses to store and process vast amounts of data efficiently. According to recent statistics, 56% of healthcare organisations have adopted predictiveanalytics to improve patient outcomes.
In this blog, well explore the 5 key components of Power BI , their features, and how they can help you make data-driven decisions. Key Takeaways User-Friendly Interface: Simplifies dataanalysis for non-technical users. Key Features Data Import: Connects to multiple data sources like Excel, SQL Server, or cloud services.
There are three main types, each serving a distinct purpose: Descriptive Analytics (Business Intelligence): This focuses on understanding what happened. Think of it as summarizing past data to answer questions like “Which products are selling best?” ” or “What are our customer demographics?”
This helps facilitate data-driven decision-making for businesses, enabling them to operate more efficiently and identify new opportunities. Definition and significance of data science The significance of data science cannot be overstated. Machine learning engineer: Focuses on the development of predictive models.
We organize all of the trending information in your field so you don't have to. Join 17,000+ users and stay up to date on the latest articles your peers are reading.
You know about us, now we want to get to know you!
Let's personalize your content
Let's get even more personalized
We recognize your account from another site in our network, please click 'Send Email' below to continue with verifying your account and setting a password.


Let's personalize your content