Top 7 YouTube Courses on Data Analytics
KDnuggets
FEBRUARY 25, 2022
Learn data analytics by taking the best YouTube courses. These courses will cover data analysis with Python, R, SQL, PowerBI, Tableau, Excel, and SPSS.
 Data Analysis Python Tableau
KDnuggets
FEBRUARY 25, 2022
Learn data analytics by taking the best YouTube courses. These courses will cover data analysis with Python, R, SQL, PowerBI, Tableau, Excel, and SPSS.

Data Science Dojo
JULY 17, 2023
To address this challenge, businesses need to use advanced data analysis methods. These methods can help businesses to make sense of their data and to identify trends and patterns that would otherwise be invisible. In recent years, there has been a growing interest in the use of artificial intelligence (AI) for data analysis.
This site is protected by reCAPTCHA and the Google Privacy Policy and Terms of Service apply.

Data Science Dojo
OCTOBER 31, 2024
For instance, Berkeley’s Division of Data Science and Information points out that entry level data science jobs remote in healthcare involves skills in NLP (Natural Language Processing) for patient and genomic data analysis, whereas remote data science jobs in finance leans more on skills in risk modeling and quantitative analysis.

Analytics Vidhya
JUNE 20, 2023
According to the Bureau of Labor Statistics (BLS), the employment of research analysts, including data analysts, is projected to increase by 23% from 2021 to 2031. This significant growth in data analysis careers presents promising prospects for aspiring candidates.

Data Science Dojo
AUGUST 27, 2024
Python, R, and SQL: These are the most popular programming languages for data science. Libraries and Tools: Libraries like Pandas, NumPy, Scikit-learn, Matplotlib, Seaborn, and Tableau are like specialized tools for data analysis, visualization, and machine learning. It’s like deciphering a secret code.

Data Science Dojo
MAY 22, 2023
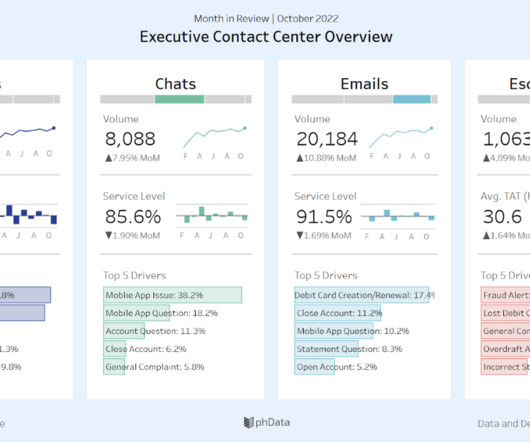
Benefits of data visualization Data visualization has several advantages for business analytics, including 1. Improved communication and understanding of data Visualizations make it easier to communicate complex data to stakeholders who may not have a background in data analysis.

Tableau
SEPTEMBER 26, 2023
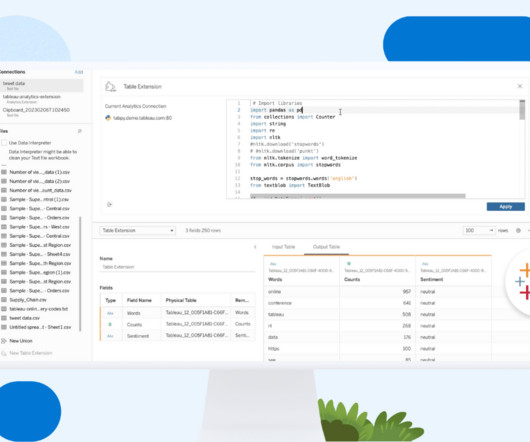
At the root, an Analytics Extension is a server that you stand up to receive data from Tableau in real-time. This data can then be scored, transformed, or augmented to facilitate dynamic exploration. Use Analytics Extensions in Table Calculations Table calculations trigger upon interaction and allow for dynamic what-if analysis.

Expert insights. Personalized for you.


Let's personalize your content