This site uses cookies to improve your experience. To help us insure we adhere to various privacy regulations, please select your country/region of residence. If you do not select a country, we will assume you are from the United States. Select your Cookie Settings or view our Privacy Policy and Terms of Use.
Cookie Settings
Cookies and similar technologies are used on this website for proper function of the website, for tracking performance analytics and for marketing purposes. We and some of our third-party providers may use cookie data for various purposes. Please review the cookie settings below and choose your preference.
Used for the proper function of the website
Used for monitoring website traffic and interactions
Cookie Settings
Cookies and similar technologies are used on this website for proper function of the website, for tracking performance analytics and for marketing purposes. We and some of our third-party providers may use cookie data for various purposes. Please review the cookie settings below and choose your preference.
Strictly Necessary: Used for the proper function of the website
Performance/Analytics: Used for monitoring website traffic and interactions
The business analyst is focused on understanding the company’s goals, identifying opportunities for improvement, and ensuring that the business strategy aligns with market demands.
This article was published as a part of the Data Science Blogathon This article covers all the basic to intermediate concepts and features of Tableau from scratch. Introduction to DataVisualization using Tableau Our goal as DataAnalysts is to get […].
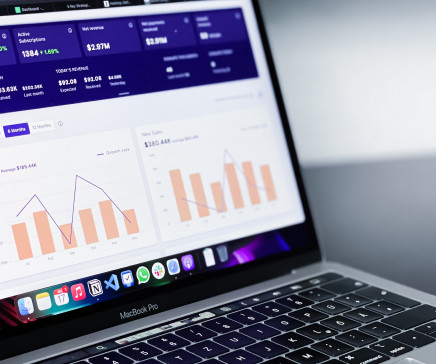
Visually-displayed data is much more accessible, and it’s criticalto promptly identify the weaknesses of an organization, accurately forecasttrading volumes and sale prices, or make the right business choices.
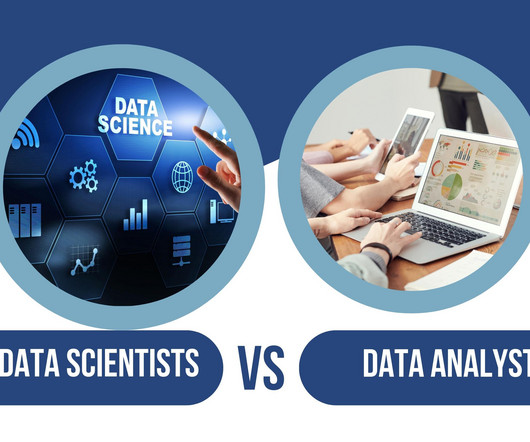
The field of data science and analytics is booming, with exciting career opportunities for those with the right skills and expertise. So, let’s […] The post Data Scientist vs DataAnalyst: Which is a Better Career Option to Pursue in 2023? appeared first on Analytics Vidhya.
Are you interested in learning more about the essential skills for dataanalysts to succeed in today’s data-driven world? The good news is that you don’t need to be an engineer, scientist, or programmer to acquire the necessary data analysis skills. Who are dataanalysts?
This article was published as a part of the Data Science Blogathon Introduction Dash is an open-source web framework for creating analytical dashboards and datavisualizations. It helps dataanalysts to deploy dashboards and serve these dashboards to the main web application.
Introduction This article delves into the intricate art of datavisualization and demystifies the process of creating, customizing, and interpreting timeseries line plots.
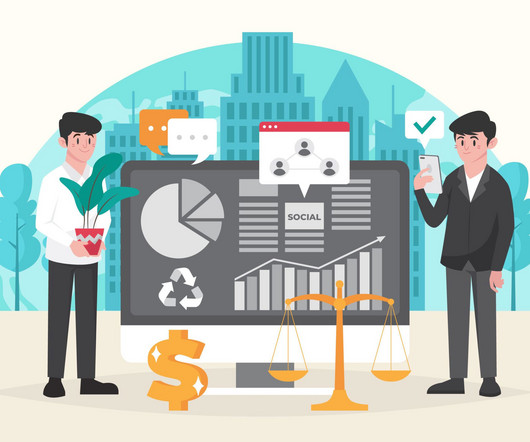
Every company collects data , analyzes it, and makes its marketing and sales strategies based on the data’s results to attract more customers and increase sales and profits. Here comes the role of the dataanalyst. Unsurprisingly, those pursuing careers in data analysis are highly sought after.
Salary Trends – The average salary for data scientists ranges from $100,000 to $150,000 per year, with senior-level positions earning even higher salaries. DataAnalystDataanalysts are responsible for collecting, analyzing, and interpreting large sets of data to identify patterns and trends.
Data is an essential component of any business, and it is the role of a dataanalyst to make sense of it all. Power BI is a powerful datavisualization tool that helps them turn raw data into meaningful insights and actionable decisions. How does a dataanalyst use Power BI?
This article was published as a part of the Data Science Blogathon What is EDA(Exploratory data analysis)? Exploratory data analysis is a great way of understanding and analyzing the data sets. The post Exploratory Data Analysis on UBER Stocks Dataset appeared first on Analytics Vidhya.
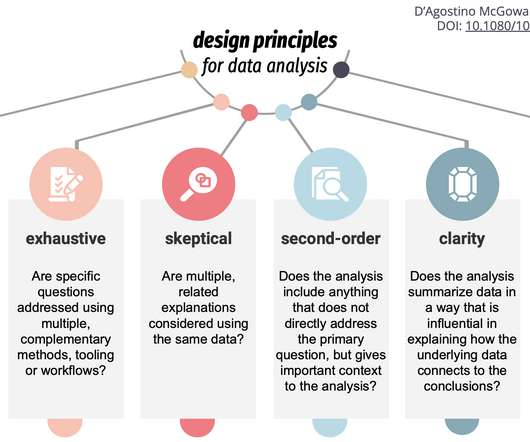
Hicks explain their work in the Journal of Computational and Graphical Statistics : The design principles for data analysis are qualities or characteristics that are relevant to the analysis and can be observed or measured.
The Best 8 GPTs for Data Science on the GPT Store From the GPT store of OpenAI , below is a list of the 8 most popular GPTs for data science for you to explore. DataAnalystDataAnalyst is a featured GPT in the store that specializes in data analysis and visualization.
Also: Types of Bias in Machine Learning; Deep Learning Next Step: Transformers and Attention Mechanism; New Poll: Data Science Skills; R Users Salaries from the 2019 Stackoverflow Survey; How to Sell Your Boss on the Need for Data Analytics.
Their role is crucial in understanding the underlying data structures and how to leverage them for insights. Key Skills Proficiency in SQL is essential, along with experience in datavisualization tools such as Tableau or Power BI. You could apply your skills in industries like finance, healthcare, and even fashion.
These skills include programming languages such as Python and R, statistics and probability, machine learning, datavisualization, and data modeling. Data preparation is an essential step in the data science workflow, and data scientists should be familiar with various data preparation tools and best practices.
By harnessing the power of machine learning (ML) and natural language processing (NLP), businesses can streamline their data analysis processes and make more informed decisions. Augmented analytics is the integration of ML and NLP technologies aimed at automating several aspects of data preparation and analysis.
Even if you don’t have a degree, you might still be pondering, “How to become a data scientist?” ” Datavisualization and communication It’s not enough to uncover insights from data; a data scientist must also communicate these insights effectively.
No-code prompts for rapid datavisualization reporting This member-only story is on us. As a computer science professor of 20+ years, I have heaps of experience in writing Python code for datavisualizations. This has changed with the new data analysis tools that are built in to the GPT-4 chat interface.
” 1 Business and dataanalysts are intimately familiar with the growing business need for precise, real-time intelligence. They are being increasingly challenged to improve efficiency and cost savings, embrace automation, and engage in data-driven decision making that helps their organization stand out from the competition.
Summary: Struggling to translate data into clear stories? This datavisualization tool empowers DataAnalysts with drag-and-drop simplicity, interactive dashboards, and a wide range of visualizations. Mastering Tableau elevates an analyst’s value and unlocks career opportunities.
The career of a DataAnalyst is highly lucrative today and with the right skills, your dream job is just around the corner. It is expected that the Data Science market will have more than 11 million job roles in India by 2030, opening up opportunities for you. How to build a DataAnalyst Portfolio?
If you’re an aspiring professional in the technological world and love to play with numbers and codes, you have two career paths- DataAnalyst and Data Scientist. What are the critical differences between DataAnalyst vs Data Scientist? Who is a Data Scientist? Who is a DataAnalyst?
Data analytics has accompanied me for 15 years already. I started my career as a dataanalyst in a controlling department immediately following my graduation from the University of West Bohemia; I now work as a data scientist providing consultancy services for a range of different fields.
BI software provides businesses with the opportunity to aggregate and organize data into compatible formats and then present data using a varied range of data reports, charts and graphs. This helps dataanalysts to understand the relations between business entities and create meaningful links to perform data analytics.
In this blog post, we will explore how to get a DataAnalyst job as a Fresher. Accordingly, the blog will explore the skills and tools required for a career in data analysis, the importance of building a strong educational foundation, and strategies for getting a job in data analysis as a fresher.
Dataanalysts are an important part of modern business, and this article will not argue otherwise. But it will argue that not every company, department, and team needs a dataanalyst to become data-driven. But I knew […] The post Becoming Data-Driven Without a DataAnalyst appeared first on DATAVERSITY.
This blog lists down-trending data science, analytics, and engineering GitHub repositories that can help you with learning data science to build your own portfolio. What is GitHub? GitHub is a powerful platform for data scientists, dataanalysts, data engineers, Python and R developers, and more.
This comprehensive blog outlines vital aspects of DataAnalyst interviews, offering insights into technical, behavioural, and industry-specific questions. It covers essential topics such as SQL queries, datavisualization, statistical analysis, machine learning concepts, and data manipulation techniques.
Summary: The blog delves into the 2024 DataAnalyst career landscape, focusing on critical skills like Data Visualisation and statistical analysis. It identifies emerging roles, such as AI Ethicist and Healthcare DataAnalyst, reflecting the diverse applications of Data Analysis.
So, let’s distinguish between some common data roles – data engineer, data scientist, and dataanalyst. A data engineer focuses on implementing infrastructure for data acquisition and data transformation to ensure data availability to other roles.
GPT-4 no-code prompting for rapid datavisualization reporting As a computer science professor of 20+ years, I have oodles of experience in coding Python for datavisualizations. Until recently, the generation of beautiful datavisualizations has been the domain of folks like me — computer programmers and dataanalysts.
Dataanalysts are specialists in statistics, mathematics, and computer science, enabling them to serve in a variety of departments, including operations analysis, financial analysis, and marketing analysis. Why Hire a DataAnalyst? The post What to Look for When Hiring a DataAnalyst appeared first on DATAVERSITY.
Summary: Datavisualization is the art of transforming complex data sets into easily understandable visuals like charts, graphs, and maps. By presenting information visually, datavisualization allows us to communicate insights clearly and effectively to a wider audience.
Do you want to be a dataanalyst? Dataanalysts are in high demand: From technology giants like IBM and Microsoft to our favorite media streaming providers like Netflix and Amazon Prime, organizations are increasingly relying on data analytics to make smart business decisions. […]. If so, great career choice!
While machine learning frameworks and platforms like PyTorch, TensorFlow, and scikit-learn can perform data exploration well, it’s not their primary intent. There are also plenty of datavisualization libraries available that can handle exploration like Plotly, matplotlib, D3, Apache ECharts, Bokeh, etc.
It has a wide range of machine 6: Tableau Tableau is a datavisualization software platform that can be used to create interactive dashboards and reports. It is a powerful tool that can be used to explore and understand data, and it can also be used to communicate insights to others.
Summary: Data Analysis focuses on extracting meaningful insights from raw data using statistical and analytical methods, while datavisualization transforms these insights into visual formats like graphs and charts for better comprehension. Deep Dive: What is DataVisualization?
The conference brings together business leaders, dataanalysts, and technology professionals to discuss the latest trends and innovations in data and analytics, and how they can be applied to drive business success.
Why Your Current Visualizations Arent Telling the Full Story This member-only story is on us. Photo by Firmbee.com on Unsplash When it comes to datavisualization, Plotly is one of my go-to tools. Every dataanalyst or scientist uses correlation to visualize the relationships in the data.
Why Your Current Visualizations Arent Telling the Full Story This member-only story is on us. Photo by Firmbee.com on Unsplash When it comes to datavisualization, Plotly is one of my go-to tools. Every dataanalyst or scientist uses correlation to visualize the relationships in the data.
Colten Woo November 15, 2023 - 5:12pm Daniel Platt Senior Product Manager, Tableau The quest for timely, accurate, and actionable insights is perennial in the ever-evolving data analytics landscape. Business users and dataanalysts alike grapple with the challenge of translating vast swathes of data into meaningful narratives.
This post looks at some of the open source datavisualization tools our customers tell us theyve tried before upgrading to our fully-supported toolkits for their analysis apps. Teams working on datavisualization applications always aim to build the best product they can. js) GraphViz Viz.js
We organize all of the trending information in your field so you don't have to. Join 17,000+ users and stay up to date on the latest articles your peers are reading.
You know about us, now we want to get to know you!
Let's personalize your content
Let's get even more personalized
We recognize your account from another site in our network, please click 'Send Email' below to continue with verifying your account and setting a password.


Let's personalize your content