This site uses cookies to improve your experience. To help us insure we adhere to various privacy regulations, please select your country/region of residence. If you do not select a country, we will assume you are from the United States. Select your Cookie Settings or view our Privacy Policy and Terms of Use.
Cookie Settings
Cookies and similar technologies are used on this website for proper function of the website, for tracking performance analytics and for marketing purposes. We and some of our third-party providers may use cookie data for various purposes. Please review the cookie settings below and choose your preference.
Used for the proper function of the website
Used for monitoring website traffic and interactions
Cookie Settings
Cookies and similar technologies are used on this website for proper function of the website, for tracking performance analytics and for marketing purposes. We and some of our third-party providers may use cookie data for various purposes. Please review the cookie settings below and choose your preference.
Strictly Necessary: Used for the proper function of the website
Performance/Analytics: Used for monitoring website traffic and interactions
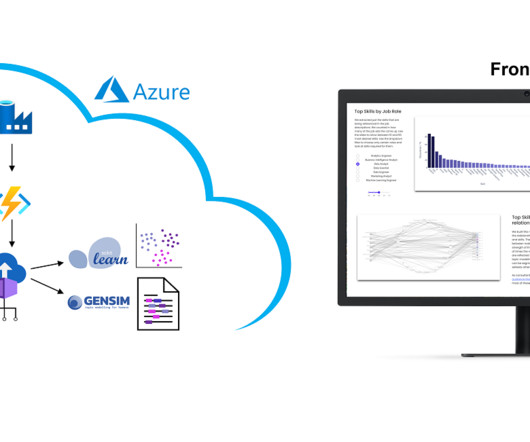
These experiences facilitate professionals from ingesting data from different sources into a unified environment and pipelining the ingestion, transformation, and processing of data to developing predictive models and analyzing the data by visualization in interactive BI reports. Choose a visual of interest.
However, we collect these over time and will make trends secure, for example how the demand for Python, SQL or specific tools such as dbt or PowerBI changes. For DATANOMIQ this is a show-case of the coming Data as a Service ( DaaS ) Business. Why we did it? It is a nice show-case many people are interested in.
How to Optimize PowerBI and Snowflake for Advanced Analytics Spencer Baucke May 25, 2023 The world of business intelligence and data modernization has never been more competitive than it is today. Table of Contents Why Discuss Snowflake & PowerBI?
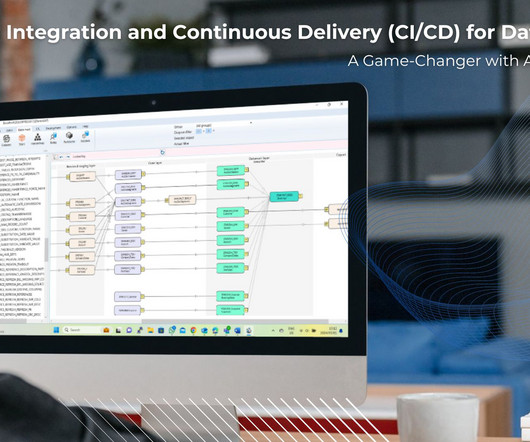
Continuous Integration and Continuous Delivery (CI/CD) for Data Pipelines: It is a Game-Changer with AnalyticsCreator! The need for efficient and reliable data pipelines is paramount in data science and dataengineering. Data Lakes : It supports MS Azure Blob Storage. pipelines, Azure Data Bricks.
Microsoft Fabric combines multiple elements into a single platform – Image courtesy of Microsoft The contribution of PowerBI The integration of Microsoft PowerBI and Microsoft Fabric offers a powerful combination for organizations seeking comprehensive data analytics and insights.
Summary : Microsoft Fabric is an end-to-end Data Analytics platform designed for integration, processing, and advanced insights, while PowerBI excels in creating interactive visualisations and reports. Both tools complement each other, enabling seamless data management and visualisation. What is PowerBI?
Their role is crucial in understanding the underlying data structures and how to leverage them for insights. Key Skills Proficiency in SQL is essential, along with experience in data visualization tools such as Tableau or PowerBI. This role builds a foundation for specialization.
This blog lists down-trending data science, analytics, and engineering GitHub repositories that can help you with learning data science to build your own portfolio. What is GitHub? GitHub is a powerful platform for data scientists, data analysts, dataengineers, Python and R developers, and more.
The field of data science is now one of the most preferred and lucrative career options available in the area of data because of the increasing dependence on data for decision-making in businesses, which makes the demand for data science hires peak. Their insights must be in line with real-world goals.
In reality, to create a comprehensive and holistic view of your business, the analyst will likely need to go beyond the data warehouse and integrate data from several different, often disparate, sources. While switching data sources isn’t as easy as a click of a button, it is doable with some minor edits in the M Code in Power Query.
Data Mesh on Azure Cloud with Databricks and Delta Lake for Applications of Business Intelligence, Data Science and Process Mining. Microsoft Azure Cloud is favored by many companies, especially for European industrial companies, due to its scalability, flexibility, and industry-specific solutions.
This blog post explores effective strategies for gathering requirements in your data project. Whether you are a data analyst , project manager, or dataengineer, these approaches will help you clarify needs, engage stakeholders, and ensure requirements gathering techniques to create a roadmap for success.
Dataengineering has become an integral part of the modern tech landscape, driving advancements and efficiencies across industries. At the heart of this revolution are open-source tools, offering powerful capabilities, flexibility, and a thriving community support system.
Unfolding the difference between dataengineer, data scientist, and data analyst. Dataengineers are essential professionals responsible for designing, constructing, and maintaining an organization’s data infrastructure. Read more to know.
Key Tools and Techniques Business Analytics employs various tools and techniques to process and interpret data effectively. Dashboards, such as those built using Tableau or PowerBI , provide real-time visualizations that help track key performance indicators (KPIs). Data Scientists require a robust technical foundation.
Enrich dataengineering skills by building problem-solving ability with real-world projects, teaming with peers, participating in coding challenges, and more. Globally several organizations are hiring dataengineers to extract, process and analyze information, which is available in the vast volumes of data sets.
Data Storytelling in Action: This panel will discuss the importance of data visualization in storytelling in different industries, different visualization tools, tips on improving one’s visualization skills, personal experiences, breakthroughs, pressures, and frustrations as well as successes and failures.
The creation of this data model requires the data connection to the source system (e.g. SAP ERP), the extraction of the data and, above all, the data modeling for the event log. It is therefore hardly surprising that some process mining tools are actually just a plugin for PowerBI, Tableau or Qlik.
In today’s rapidly evolving digital landscape, seamless data, applications, and device integration are more pressing than ever. Enter Microsoft Fabric, a cutting-edge solution designed to revolutionize how we interact with technology.
These tools offer a wide range of functionalities to handle complex data preparation tasks efficiently. The tool also employs AI capabilities for automatically providing attribute names and short descriptions for reports, making it easy to use and efficient for data preparation.
Inconsistent data quality: The uncertainty surrounding the accuracy, consistency and reliability of data pulled from various sources can lead to risks in analysis and reporting. The consumer can create a “Python script” connection in Microsoft PowerBI and start creating BI reports for further BI analysis on data products.
ArticleVideo Book This article was published as a part of the Data Science Blogathon 1. INTRODUCTION Data visualization is one of the important aspects of. The post Embed PowerBI report in Jupyter Notebook using “powerbiclient” appeared first on Analytics Vidhya.
R : Often used for statistical analysis and data visualization. Data Visualization : Techniques and tools to create visual representations of data to communicate insights effectively. Tools like Tableau, PowerBI, and Python libraries such as Matplotlib and Seaborn are commonly taught.
” Data visualization and communication It’s not enough to uncover insights from data; a data scientist must also communicate these insights effectively. This is where data visualization comes in. Tools like Tableau, Matplotlib, Seaborn, or PowerBI can be incredibly helpful.
Because they are the most likely to communicate data insights, they’ll also need to know SQL, and visualization tools such as PowerBI and Tableau as well. Machine Learning Engineer Machine learning engineers will use data much differently than business analysts or data analysts.
To pursue a data science career, you need a deep understanding and expansive knowledge of machine learning and AI. Data scientists will typically perform data analytics when collecting, cleaning and evaluating data.
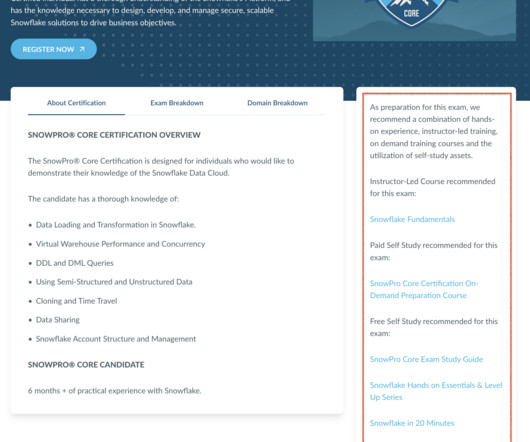
The exam will cover all aspects of using Snowflake and its components to apply data analysis principles, from preparing and loading data to presenting data and meeting business requirements. I found the DataEngineering Simplified’s playlists particularly beneficial during my studies.
While a data analyst isn’t expected to know more nuanced skills like deep learning or NLP, a data analyst should know basic data science, machine learning algorithms, automation, and data mining as additional techniques to help further analytics. As you see, there are a number of reporting platforms as expected.
With Snowflake, manufacturers can easily access and analyze data from a wide range of sources, including production data, customer data, and supply chain data, to make informed decisions and optimize their operations. In Conclusion Analytics is a powerful asset that can be used in many different ways in manufacturing.
For instance, feature engineering and exploratory data analysis (EDA) often require the use of visualization libraries like Matplotlib and Seaborn. Moreover, tools like PowerBI and Tableau can produce remarkable results. In the data science industry, effective communication and collaboration play a crucial role.
Making reports and visuals: SQL data analysts are responsible for creating reports and visualisations that aid stakeholders in comprehending and interpreting data. They must be proficient in data visualisation and can produce eye-catching visuals using Tableau, PowerBI , or Excel.
Scala is worth knowing if youre looking to branch into dataengineering and working with big data more as its helpful for scaling applications. Knowing all three frameworks covers the most ground for aspiring data science professionals, so you cover plenty of ground knowing thisgroup.
I have Lead & Managed a team of data analysts, business analysts, dataengineers, ML engineers, DevOps engineers, and Data Scientists. I have worked on several key strategic & data-monetization initiatives in the past.
Data Preparation: Cleaning, transforming, and preparing data for analysis and modelling. Collaborating with Teams: Working with dataengineers, analysts, and stakeholders to ensure data solutions meet business needs.
A modern data stack can streamline IT bottlenecks, accelerating access to various teams that require data: Data analysts. Data scientists. Software engineers. Cloud engineers. Dataengineers. Basically, a modern data stack can be adopted by any company that wants to improve its data management.
Career Progression As you gain experience and expertise in Data Science, you have the opportunity for career progression. Roles such as Data Scientist, Machine Learning Engineer, Data Analyst, and DataEngineer offer clear pathways for growth and specialization.
The software you might use OAuth with includes: Tableau PowerBI Sigma Computing If so, you will need an OAuth provider like Okta, Microsoft Azure AD, Ping Identity PingFederate, or a Custom OAuth 2.0 That’s why it’s so valuable to have experienced dataengineers on your side, like the ones here at phData.
Die Bedeutung effizienter und zuverlässiger Datenpipelines in den Bereichen Data Science und DataEngineering ist enorm. Data Lakes: Unterstützt MS Azure Blob Storage. Frontends : Kompatibel mit Tools wie PowerBI, Qlik Sense und Tableau.
Process Mining wurde kürzlich in die Power Automate Plattform und in PowerBI integriert. Process Mining Tools, die Business Intelligence Software erweitern Und dann gibt es noch diejenigen Anbieter, die bestehende BI Tools mit Erweiterungen zum Process Mining Analysewerkzeug machen. nicht mehr weiterentwickelt wird.
Von Big Data über Data Science zu AI Einer der Gründe, warum Big Data insbesondere nach der Euphorie wieder aus der Diskussion verschwand, war der Leitspruch “S**t in, s**t out” und die Kernaussage, dass Daten in großen Mengen nicht viel wert seien, wenn die Datenqualität nicht stimme.
Unabhängiges und Nachhaltiges DataEngineering Die Arbeit hinter Process Mining kann man sich wie einen Eisberg vorstellen. Die sichtbare Spitze des Eisbergs sind die Reports und Analysen im Process Mining Tool. Das ist der Teil, den die meisten Analysten und sonstigen Benutzer des Tools zu Gesicht bekommen.
Healthcare Data Scientists use a variety of tools, including programming languages like Python and R, Machine Learning libraries like TensorFlow and scikit-learn, and data visualization tools like Tableau and PowerBI. They also use specialized healthcare analytics platforms and databases.
2024’s top PowerBI interview questions simplified. More to discover: Top 35 Data Analyst Interview Questions and Answers 2023. DataEngineering Interview Questions and Answers. By familiarising yourself with these concepts, you’ll be better prepared for more advanced topics and real-world applications.
Summary: Dataengineering tools streamline data collection, storage, and processing. Tools like Python, SQL, Apache Spark, and Snowflake help engineers automate workflows and improve efficiency. Learning these tools is crucial for building scalable data pipelines. Thats where dataengineering tools come in!
We organize all of the trending information in your field so you don't have to. Join 17,000+ users and stay up to date on the latest articles your peers are reading.
You know about us, now we want to get to know you!
Let's personalize your content
Let's get even more personalized
We recognize your account from another site in our network, please click 'Send Email' below to continue with verifying your account and setting a password.


Let's personalize your content