This site uses cookies to improve your experience. To help us insure we adhere to various privacy regulations, please select your country/region of residence. If you do not select a country, we will assume you are from the United States. Select your Cookie Settings or view our Privacy Policy and Terms of Use.
Cookie Settings
Cookies and similar technologies are used on this website for proper function of the website, for tracking performance analytics and for marketing purposes. We and some of our third-party providers may use cookie data for various purposes. Please review the cookie settings below and choose your preference.
Used for the proper function of the website
Used for monitoring website traffic and interactions
Cookie Settings
Cookies and similar technologies are used on this website for proper function of the website, for tracking performance analytics and for marketing purposes. We and some of our third-party providers may use cookie data for various purposes. Please review the cookie settings below and choose your preference.
Strictly Necessary: Used for the proper function of the website
Performance/Analytics: Used for monitoring website traffic and interactions
Row-level security is a powerfuldatagovernance capability across many business intelligence platforms, and PowerBI is no exception. Learning how to implement row-level security is critical for any PowerBI developer hoping to add an extra layer of security to their reports and datasets.
Support for Various Data Warehouses and Databases : AnalyticsCreator supports MS SQL Server 2012-2022, Azure SQL Database, Azure Synapse Analytics dedicated, and more. Data Lakes : It supports MS Azure Blob Storage. Frontends : AnalyticsCreator supports PowerBI, Qlik Sense, Tableau, PowerPivot (Excel).
One of the great things about PowerBI is all of the native connectors that exist, making it extremely easy for developers to seamlessly connect to the source system and pull their data into PowerBI. Check out this blog on how to enable SSO for Snowflake in PowerBI.
Summary: This blog dives into the most promising PowerBI projects, exploring advanced data visualization, AI integration, IoT & blockchain analytics, and emerging technologies. Discover best practices for successful implementation and propel your organization towards data-driven success.
Data Mesh on Azure Cloud with Databricks and Delta Lake for Applications of Business Intelligence, Data Science and Process Mining. Databricks is an ideal tool for realizing a Data Mesh due to its unified data platform, scalability, and performance.
The Datamarts capability opens endless possibilities for organizations to achieve their data analytics goals on the PowerBI platform. Before we look into the PowerBI Datamarts, let us take a step back and understand the meaning of a Datamart. What is PowerBI Datamarts?
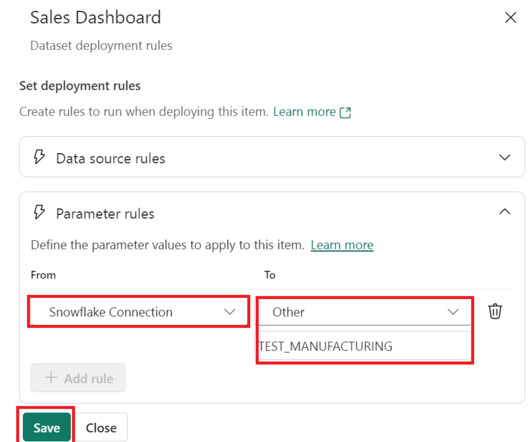
PowerBI Deployment Pipelines are great for several reasons. They not only do away with the manual aspects of moving PowerBI content from one workspace to another in the development lifecycle, but they can also automate the transitioning of the data sources used by your datasets from one environment to another.
Summary: Data Visualisation is crucial to ensure effective representation of insights tableau vs powerbi are two popular tools for this. This article compares Tableau and PowerBI, examining their features, pricing, and suitability for different organisations. What is PowerBI? billion in 2023.
As organizations embrace the power of self-service analytics and interactive dashboards, transitioning from SSRS to PowerBI becomes an enticing and oftentimes necessary decision. The PowerBI Service further enhances collaboration by enabling easy sharing and embedding reports in web pages and applications.
Their role is crucial in understanding the underlying data structures and how to leverage them for insights. Key Skills Proficiency in SQL is essential, along with experience in data visualization tools such as Tableau or PowerBI.
This capability ensures that users can focus on insights rather than data gathering, significantly reducing time spent on preliminary stages of analysis. Data visualization tools Advanced visualization tools like Tableau and Microsoft PowerBI enable users to interpret data through graphical formats.
PowerBI Datamarts is one of the most exciting features that Microsoft has released for the Power Platform in recent years. If you need high-level information on what a PowerBI Datamart is and some example use cases, check out our other blog, What Are PowerBI Datamarts?
Regular audits: Conduct regular audits of data to identify and correct any issues. This can involve comparing data across different sources, formats, and time periods. Datagovernance: Establish clear policies and procedures for data management, including data quality standards, data ownership, and data privacy.
Actionable steps: Inventory existing data : Identify what data is currently available and assess its quality. Define data needs : Specify datasets, attributes, granularity, and update frequency. Address datagovernance : Ensure requirements include compliance with regulations like GDPR or CCPA.
Regular audits: Conduct regular audits of data to identify and correct any issues. This can involve comparing data across different sources, formats, and time periods. Datagovernance: Establish clear policies and procedures for data management, including data quality standards, data ownership, and data privacy.
Business intelligence software will be more geared towards working with Big Data. DataGovernance. One issue that many people don’t understand is datagovernance. It is evident that challenges of data handling will be present in the future too. Yet, there are promising rival products, worth attention.
It is therefore hardly surprising that some process mining tools are actually just a plugin for PowerBI, Tableau or Qlik. They offer consistency and standardization across data structures, improving data accuracy and integrity. This centralized approach streamlines datagovernance and management, enhancing efficiency.
There is a plethora of BI tools available in the market today, with new ones being added yearly. Through a comparative analysis of some of the leading BI tools: Google Looker, Microsoft PowerBI, Tableau and Qlik Sense, discover which BI solution best fits your organization’s data analytics needs to empower informed decision-making.
Actually, with Solomon-like wisdom, Zaidi and Thanaraj suggest a scenario where data fabric and data mesh work together — a Reese’s Peanut Butter Cup of data architecture, representing a “meshy fabric” scenario I presented last year. Datagovernance. “I He compared governance to the U.S.
Summary: Descriptive Analytics tools transform historical data into visual reports, helping businesses identify trends and improve decision-making. Popular tools like PowerBI, Tableau, and Google Data Studio offer unique features for Data Analysis.
GDPR helped to spur the demand for prioritized datagovernance , and frankly, it happened so fast it left many companies scrambling to comply — even still some are fumbling with the idea. Professionals adept at this skill will be desirable by corporations, individuals and government offices alike. The Rise of Regulation.
So when leading software review site TrustRadius announced that we had won their “Top Rated” awards in Data Catalog , Data Collaboration, DataGovernance , and Metadata Management we were thrilled, but not surprised, since usability has been core to Alation’s product DNA since day 1. What does “Top Rated” mean?
Processing frameworks like Hadoop enable efficient data analysis across clusters. Analytics tools help convert raw data into actionable insights for businesses. Strong datagovernance ensures accuracy, security, and compliance in data management. What is Big Data? How Does Big Data Ensure Data Quality?
Processing frameworks like Hadoop enable efficient data analysis across clusters. Analytics tools help convert raw data into actionable insights for businesses. Strong datagovernance ensures accuracy, security, and compliance in data management. What is Big Data? How Does Big Data Ensure Data Quality?
Moreover, regulatory requirements concerning data utilisation, like the EU’s General Data Protection Regulation GDPR, further complicate the situation. Such challenges can be mitigated by durable datagovernance, continuous training, and high commitment toward ethical standards.
phData has many resources and information about Snowflake and how the AI Data Cloud can turn your business into one with a thriving data culture. Establishing a Foundation for Data Culture Datagovernance is going to be the foundation of every data culture. This is where Snowflake comes to the rescue!
Because they are the most likely to communicate data insights, they’ll also need to know SQL, and visualization tools such as PowerBI and Tableau as well. Machine Learning Engineer Machine learning engineers will use data much differently than business analysts or data analysts.
So when leading software review site TrustRadius announced that we had won their “Top Rated” awards in Data Catalog , Data Collaboration, DataGovernance , and Metadata Management we were thrilled, but not surprised, since usability has been core to Alation’s product DNA since day 1. What does “Top Rated” mean?
Here are steps you can follow to pursue a career as a BI Developer: Acquire a solid foundation in data and analytics: Start by building a strong understanding of data concepts, relational databases, SQL (Structured Query Language), and data modeling.
Use Case : Apache Nifi is best suited for organisations that require real-time monitoring and high-volume data processing, such as IoT data streams or sensor data. It offers a robust suite of data integration tools, including datagovernance, quality, and master data management.
To handle sparse data effectively, consider using junk dimensions to group unrelated attributes or creating factless fact tables that capture events without associated measures. Ensuring Data Consistency Maintaining data consistency across multiple fact tables can be challenging, especially when dealing with conformed dimensions.
I contributed by providing data insights, developing predictive models, and presenting findings, ultimately leading to more targeted marketing strategies and increased customer engagement. DataGovernance and Ethics Questions What is datagovernance, and why is it important? Access to IBM Cloud Lite account.
Data Analyst also maintain data lineage and documentation to enhance data transparency and auditability Tableau: Unveiling the Magic Behind the Data Tableau is a visual analytics platform that empowers Data Analysts to transform data into interactive, easy-to-understand visualizations.
Data Quality Issues Operations Analysts rely heavily on data to inform their recommendations. However, poor data quality can lead to inaccurate analyses and flawed decision-making. Solution: Analysts should implement robust datagovernance practices to ensure data integrity.
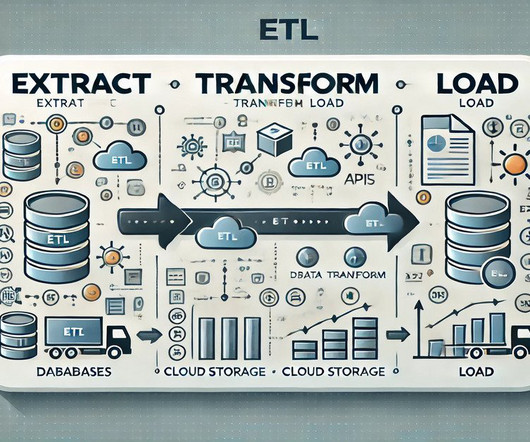
Data Integration and ETL (Extract, Transform, Load) Data Engineers develop and manage data pipelines that extract data from various sources, transform it into a suitable format, and load it into the destination systems. Data Quality and Governance Ensuring data quality is a critical aspect of a Data Engineer’s role.
Data literacy — Employees can interpret and analyze data to draw logical conclusions; they can also identify subject matter experts best equipped to educate on specific data assets. Datagovernance is a key use case of the modern data stack. Who Can Adopt the Modern Data Stack?
Tools and Technologies Python/R: Popular programming languages for data analysis and machine learning. Tableau/PowerBI: Visualization tools for creating interactive and informative data visualizations. Hadoop/Spark: Frameworks for distributed storage and processing of big data.
Employing data visualisation can help businesses uncover trends and anomalies, making it easier to analyse performance metrics and operational efficiencies. Popular tools like Tableau and PowerBI empower users to create interactive dashboards, allowing real-time data exploration.
Focus on Data Science Tools : Access high-demand tools like Tableau and PowerBI. Introduction to Data Science Using Python by Udemy Udemy’s Introduction to Data Science Using Python is an introductory course for beginners without prior experience.
A well-structured syllabus should cover: Data Visualisation Principles Understanding the principles of effective data visualisation , including clarity, accuracy, and aesthetics. Students should learn how to choose the right type of visualisation for different data types. js for creating interactive visualisations.
Data Lakes: Unterstützt MS Azure Blob Storage. Frontends : Kompatibel mit Tools wie PowerBI, Qlik Sense und Tableau. Pipelines/ETL : Unterstützt Technologien wie SQL Server Integration Services und Azure Data Factory. Versionierung : Ermöglicht die Nachverfolgung von Änderungen und die Sicherstellung der DataGovernance.
Process Mining wurde kürzlich in die Power Automate Plattform und in PowerBI integriert. Process Mining Tools, die Business Intelligence Software erweitern Und dann gibt es noch diejenigen Anbieter, die bestehende BI Tools mit Erweiterungen zum Process Mining Analysewerkzeug machen. nicht mehr weiterentwickelt wird.
Von Big Data über Data Science zu AI Einer der Gründe, warum Big Data insbesondere nach der Euphorie wieder aus der Diskussion verschwand, war der Leitspruch “S**t in, s**t out” und die Kernaussage, dass Daten in großen Mengen nicht viel wert seien, wenn die Datenqualität nicht stimme.
Eine bessere Idee ist es daher, Event Logs nicht in einzelnen Process Mining Tools aufzubereiten, sondern zentral in einem dafür vorgesehenen Data Warehouse zu erstellen, zu katalogisieren und darüber auch die grundsätzliche DataGovernance abzusichern.
We organize all of the trending information in your field so you don't have to. Join 17,000+ users and stay up to date on the latest articles your peers are reading.
You know about us, now we want to get to know you!
Let's personalize your content
Let's get even more personalized
We recognize your account from another site in our network, please click 'Send Email' below to continue with verifying your account and setting a password.


Let's personalize your content