This site uses cookies to improve your experience. To help us insure we adhere to various privacy regulations, please select your country/region of residence. If you do not select a country, we will assume you are from the United States. Select your Cookie Settings or view our Privacy Policy and Terms of Use.
Cookie Settings
Cookies and similar technologies are used on this website for proper function of the website, for tracking performance analytics and for marketing purposes. We and some of our third-party providers may use cookie data for various purposes. Please review the cookie settings below and choose your preference.
Used for the proper function of the website
Used for monitoring website traffic and interactions
Cookie Settings
Cookies and similar technologies are used on this website for proper function of the website, for tracking performance analytics and for marketing purposes. We and some of our third-party providers may use cookie data for various purposes. Please review the cookie settings below and choose your preference.
Strictly Necessary: Used for the proper function of the website
Performance/Analytics: Used for monitoring website traffic and interactions
Datamining is a fascinating field that blends statistical techniques, machine learning, and database systems to reveal insights hidden within vast amounts of data. Businesses across various sectors are leveraging datamining to gain a competitive edge, improve decision-making, and optimize operations.
You may not even know exactly which path you should pursue, since some seemingly similar fields in the data technology sector have surprising differences. We decided to cover some of the most important differences between DataMining vs Data Science in order to finally understand which is which. What is Data Science?
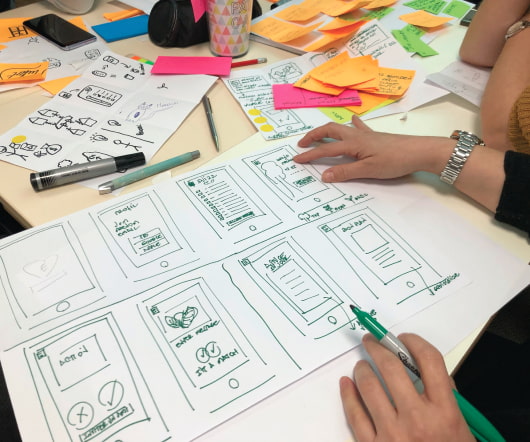
Data Analyst Data analysts are responsible for collecting, analyzing, and interpreting large sets of data to identify patterns and trends. They require strong analytical skills, knowledge of statistical analysis, and expertise in datavisualization.
The conference brings together business leaders, data analysts, and technology professionals to discuss the latest trends and innovations in data and analytics, and how they can be applied to drive business success. It is the only sponsor-free, vendor-free, and recruiter-free data science conference℠.
This article was published as a part of the Data Science Blogathon. Introduction Text Mining is also known as Text DataMining or Text Analytics or is an artificial intelligence (AI) technology that uses natural language processing (NLP) to extract essential data from standard language text.
To avoid such consequences, it’s important to be mindful of the information we share online. Visualization With a new datavisualization tool being released every month or so, visualizingdata is key to insightful results. Both DataMining and Big Data Analysis are major elements of data science.
Data-driven businesses are five times more likely to make faster decisions than their market peers, and twice as likely to land in the top quartile of financial performance within their industries. The post 6 Ways Business Intelligence is Going to Change in 2017 appeared first on Dataconomy.
Fraud prevention The third stage of the visualization-AI intelligence cycle is prevention – where data science teams use new information to train their models. This might include larger-scale datamining to gain insights on wider trends from multiple investigations.
Companies use Business Intelligence (BI), Data Science , and Process Mining to leverage data for better decision-making, improve operational efficiency, and gain a competitive edge. Process Mining offers process transparency, compliance insights, and process optimization.
Some essential research tools include search engines like Google Scholar, JSTOR, and PubMed, reference management software like Zotero, Mendeley, and EndNote, statistical analysis tools like SPSS, R, and Stata, writing tools like Microsoft Word and Grammarly, and datavisualization tools like Tableau and Excel.
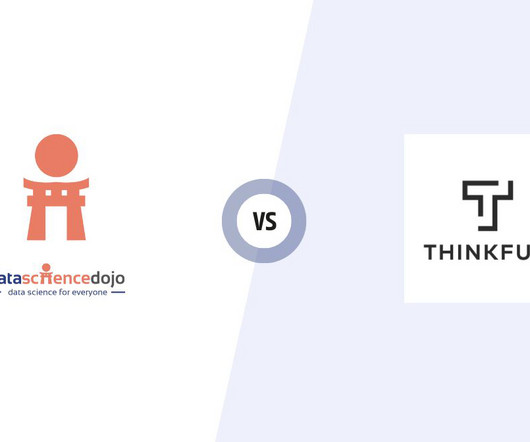
Data Science Dojo vs Thinkful Data Science Dojo As an ideal choice for beginners with no prerequisites, Data Science Dojo’s Bootcamp is a great choice. It is a one-week bootcamp that covers the fundamentals of data science.
Even as we grow in our ability to extract vital information from big data, the scientific community still faces roadblocks that pose major datamining challenges. In this article, we will discuss 10 key issues that we face in modern datamining and their possible solutions.
Big data processing With the increasing volume of data, big data technologies have become indispensable for Applied Data Science. DatavisualizationDatavisualization is the artwork of illustrating complicated facts in a graphical or pictorial format.
Data scientists are using NLP to make these assistants smarter and more helpful. Enhanced DataVisualization: AI-powered datavisualization tools are enabling data scientists to create interactive and dynamic visualizations that facilitate better communication of insights and findings.
The final point to which the data has to be eventually transferred is a destination. The destination is decided by the use case of the data pipeline. It can be used to run analytical tools and power datavisualization as well. Otherwise, it can also be moved to a storage centre like a data warehouse or lake.
This article was published as a part of the Data Science Blogathon Introduction I have been associated with Analytics Vidya from the 3rd edition of Blogathon. Unlike hackathons, where we are supposed to come up with a theme-oriented project within the stipulated time, blogathons are different.
Data is processed to generate information, which can be later used for creating better business strategies and increasing the company’s competitive edge. You can finally understand what you’re looking at and what the data is saying. It doesn’t matter if you use graphs or charts, you need to get better at datavisualization.
This article was published as a part of the Data Science Blogathon. Introduction This article will discuss some data science interview questions and their answers to help you fare well in job interviews. These are data science interview questions and are based on data science topics.
Open-source business intelligence (OSBI) is commonly defined as useful business data that is not traded using traditional software licensing agreements. This is one alternative for businesses that want to aggregate more data from data-mining processes without buying fee-based products.
That, along with datamining can help if the developer wants to work with supply chains, for example. These can help a developer find a career in the data science field. Software developers will also want to take classes in datavisualization and datamining. Machine Learning. Other coursework.
Pursuing any data science project will help you polish your resume. The post Top Data Science Projects to add to your Portfolio in 2021 appeared first on Analytics Vidhya. Introduction 2021 is a year that proved nothing is better than a Proof of Work to evaluate any candidate’s worth, initiative, and skill.
Data Science is a multidisciplinary field that uses processes, algorithms, and systems to obtain various insights coming from both structured and unstructured data. It is related to datamining, machine learning, and big data. A data scientist – the person in […].
As a data analyst, you will learn several technical skills that data analysts need to be successful, including: Programming skills. Datavisualization capability. DataMining skills. Data wrangling ability. Machine learning knowledge.
Introduction What’s most crucial to us? Could it be the ability to create a fortune, have good physical health, or be the focus of attention? In line with the latest World Happiness Report, it is evident that being happy has become a worldwide priority.
Introduction Tired of sifting through mountains of analyzing data without any real insights? With its advanced natural language processing capabilities, ChatGPT can uncover hidden patterns and trends in your data that you never thought possible. ChatGPT is here to change the game.
Given your extensive background in administration and management, how do you envision specific data science tools, such as predictive analytics, machine learning, and datavisualization, and methodologies like datamining and big data analysis, could enhance public administration and investment management?
In this digital world, Data is the backbone of all businesses. With such large-scale data production, it is essential to have a field that focuses on deriving insights from it. What is data analytics? What tools help in data analytics? How can data analytics be applied to various industries?
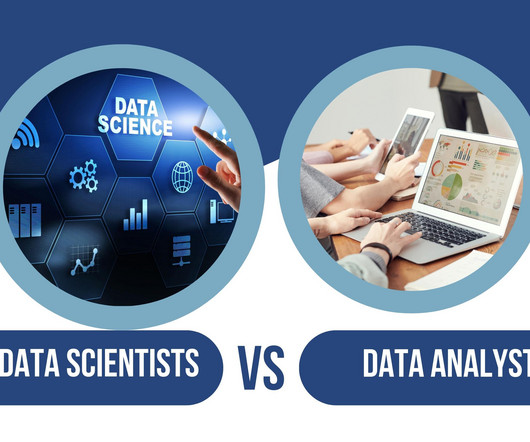
Are you a data enthusiast looking to break into the world of analytics? The field of data science and analytics is booming, with exciting career opportunities for those with the right skills and expertise. So, let’s […] The post Data Scientist vs Data Analyst: Which is a Better Career Option to Pursue in 2023?
Introduction In today’s data-driven world, the role of data scientists has become indispensable. in data science to unravel the mysteries hidden within vast data sets? But what if I told you that you don’t need a Ph.D.
Introduction With the increasing prevalence of internet usage, companies harness data’s power to drive innovation, make strategic decisions, and gain a competitive edge in the digital era. As of January 2024, 5.35 billion individuals were connected to the Internet, constituting 66.2 percent of the world’s population.
Well, it is – to the ones that are 100% familiar with it – and it involves the use of various data sources, including internal data from company databases, as well as external data, to generate insights, identify trends, and support strategic planning. In the 1990s, OLAP tools allowed multidimensional data analysis.
Learn how DirectX visualization can improve your study and assessment of different trading instruments for maximum productivity and profitability. A growing number of traders are using increasingly sophisticated datamining and machine learning tools to develop a competitive edge.
The data science lifecycle Data science is iterative, meaning data scientists form hypotheses and experiment to see if a desired outcome can be achieved using available data. js and Tableau Data science, data analytics and IBM Practicing data science isn’t without its challenges.
Business Intelligence tools encompass a variety of software applications designed to collect, process, analyse, and present business data. These tools enable organizations to convert raw data into actionable insights through various means such as reporting, analytics, datavisualization, and performance management.
Offering features like TensorBoard for datavisualization and TensorFlow Extended (TFX) for implementing production-ready ML pipelines, TensorFlow stands out as a comprehensive solution for both beginners and seasoned professionals in the realm of machine learning.
Then, an analyst prepares them for reporting (via datavisualization tools like Google Data Studio). The BigQuery tool was designed to be the centerpiece of data analysis. Conclusion Indeed BigQuery responds to all the business issues relating to the world of data (or Business Intelligence).
If you can analyze data with statistical knowledge or unsupervised machine learning, just extracting data without labeling would be enough. And sometimes ad hoc analysis with simple datavisualization will help your decision makings.
The fields have evolved such that to work as a data analyst who views, manages and accesses data, you need to know Structured Query Language (SQL) as well as math, statistics, datavisualization (to present the results to stakeholders) and datamining.
Complex data management is on the rise. The Five Pain Points of Moving Data to the Cloud. She has written hundreds of articles on datamining and information technology. Dr. Halper attributes this increase of complex data management to the growing importance of analytics. Fern Halper, Ph.D.
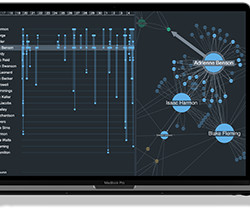
DataVisualization and Data Analysis Join some of the world’s most creative minds that are changing the way we visualize, understand, and interact with data. You’ll also learn the art of storytelling, information communication, and datavisualization using the latest open-source tools and techniques.
Here are the chronological steps for the data science journey. First of all, it is important to understand what data science is and is not. Data science should not be used synonymously with datamining. Mathematics, statistics, and programming are pillars of data science. The Fundamentals. Mathematics.
This structured organization facilitates insightful analysis, allowing you to drill down into specific details and uncover hidden relationships within your data. DataMining and Reporting Data warehouses are not passive repositories.
Significantly, Data Science experts have a strong foundation in mathematics, statistics, and computer science. Furthermore, they must be highly efficient in programming languages like Python or R and have datavisualization tools and database expertise. Who is a Data Analyst?
Some of the key tools used for Machine Learning include: Building Machine Learning Models Machine learning models make predictions or classifications based on biological data. DataMiningDatamining involves extracting patterns and insights from large datasets. Weka and R support this process.
We organize all of the trending information in your field so you don't have to. Join 17,000+ users and stay up to date on the latest articles your peers are reading.
You know about us, now we want to get to know you!
Let's personalize your content
Let's get even more personalized
We recognize your account from another site in our network, please click 'Send Email' below to continue with verifying your account and setting a password.


Let's personalize your content