This site uses cookies to improve your experience. To help us insure we adhere to various privacy regulations, please select your country/region of residence. If you do not select a country, we will assume you are from the United States. Select your Cookie Settings or view our Privacy Policy and Terms of Use.
Cookie Settings
Cookies and similar technologies are used on this website for proper function of the website, for tracking performance analytics and for marketing purposes. We and some of our third-party providers may use cookie data for various purposes. Please review the cookie settings below and choose your preference.
Used for the proper function of the website
Used for monitoring website traffic and interactions
Cookie Settings
Cookies and similar technologies are used on this website for proper function of the website, for tracking performance analytics and for marketing purposes. We and some of our third-party providers may use cookie data for various purposes. Please review the cookie settings below and choose your preference.
Strictly Necessary: Used for the proper function of the website
Performance/Analytics: Used for monitoring website traffic and interactions
Companies use Business Intelligence (BI), Data Science , and Process Mining to leverage data for better decision-making, improve operational efficiency, and gain a competitive edge. Process Mining offers process transparency, compliance insights, and process optimization.
Open-source business intelligence (OSBI) is commonly defined as useful business data that is not traded using traditional software licensing agreements. This is one alternative for businesses that want to aggregate more data from data-mining processes without buying fee-based products.
This article was published as a part of the Data Science Blogathon Introduction I have been associated with Analytics Vidya from the 3rd edition of Blogathon. Unlike hackathons, where we are supposed to come up with a theme-oriented project within the stipulated time, blogathons are different.
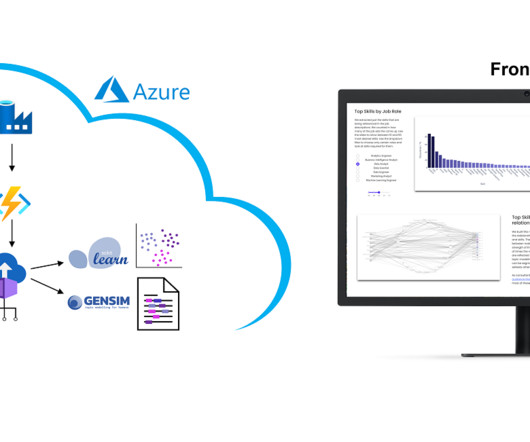
However, we collect these over time and will make trends secure, for example how the demand for Python, SQL or specific tools such as dbt or PowerBI changes. The presentation is currently limited to the current situation on the labor market. Why we did it? It is a nice show-case many people are interested in.
At its core, decision intelligence involves collecting and integrating relevant data from various sources, such as databases, text documents, and APIs. This data is then analyzed using statistical methods, machine learning algorithms, and datamining techniques to uncover meaningful patterns and relationships.
By meeting these requirements during data preprocessing, organizations can ensure the accuracy and reliability of their data-driven analyses, machine learning models, and datamining efforts. What are the best data preprocessing tools of 2023?
Nevertheless, process mining can be considered a sub-discipline of business intelligence. It is therefore hardly surprising that some process mining tools are actually just a plugin for PowerBI, Tableau or Qlik.
Data Visualization Tools These tools create visual representations of data, such as graphs and dashboards, making complex data sets easier to understand. DataMining Tools Datamining tools analyse large datasets to discover hidden patterns or relationships within the data.
Business teams still had to request data. Although it became easier for BI and analytics teams to create custom reports and dashboards in tools such as Tableau, Looker, and PowerBI those tools still isolated the user from data. Business analysts needing to find data to create new analysis and reports.
To pursue a data science career, you need a deep understanding and expansive knowledge of machine learning and AI. The data science lifecycle Data science is iterative, meaning data scientists form hypotheses and experiment to see if a desired outcome can be achieved using available data.
Some of the key tools used for data visualisation include: Tableau Tableau is a data visualisation tool that allows researchers to create interactive dashboards and reports. It is useful for visualising complex data and identifying patterns and trends. Tools like scikit-learn and TensorFlow support this process.
Business intelligence (BI) has emerged as a key solution to help companies gain insights into their operations and market trends. BI involves using datamining, reporting, and querying techniques to identify key business metrics and KPIs that can help companies make informed decisions. What is business intelligence?
Business intelligence (BI) has emerged as a key solution to help companies gain insights into their operations and market trends. BI involves using datamining, reporting, and querying techniques to identify key business metrics and KPIs that can help companies make informed decisions. What is business intelligence?
Data analysis aims to conclude meaning from unprocessed data to respond to inquiries, resolve issues, and enhance decision-making. Furthermore, looking at data from many sources, including surveys, experiments, and observational studies, may be necessary. What does Excel Do?
While a data analyst isn’t expected to know more nuanced skills like deep learning or NLP, a data analyst should know basic data science, machine learning algorithms, automation, and datamining as additional techniques to help further analytics. As you see, there are a number of reporting platforms as expected.
Their tasks encompass: Data Collection and Extraction Identify relevant data sources and gather data from various internal and external systems Extract, transform, and load data into a centralized data warehouse or analytics platform Data Cleaning and Preparation Cleanse and standardize data to ensure accuracy, consistency, and completeness.
It uses datamining , correlations, and statistical analyses to investigate the causes behind past outcomes. Employing data visualisation can help businesses uncover trends and anomalies, making it easier to analyse performance metrics and operational efficiencies.
Focus on Data Science Tools : Access high-demand tools like Tableau and PowerBI. Introduction to Data Science Using Python by Udemy Udemy’s Introduction to Data Science Using Python is an introductory course for beginners without prior experience.
Wie anfangs erwähnt, haben Unternehmen bei der Einführung von Process Mining die Qual der Wahl. Oft werden langwierige und kostenintensive Auswahlprozesse für die jeweiligen Tools angestoßen, damit die Wahl auf der augenscheinlich richtige Tool fällt.
Key skills: Proficiency in analytics tools like Spark and SQL, knowledge of statistical and machine learning methods, and experience with data visualization tools such as Tableau or PowerBI. Data analytics: Identifying trends and patterns to improve business performance.
We organize all of the trending information in your field so you don't have to. Join 17,000+ users and stay up to date on the latest articles your peers are reading.
You know about us, now we want to get to know you!
Let's personalize your content
Let's get even more personalized
We recognize your account from another site in our network, please click 'Send Email' below to continue with verifying your account and setting a password.


Let's personalize your content