This site uses cookies to improve your experience. To help us insure we adhere to various privacy regulations, please select your country/region of residence. If you do not select a country, we will assume you are from the United States. Select your Cookie Settings or view our Privacy Policy and Terms of Use.
Cookie Settings
Cookies and similar technologies are used on this website for proper function of the website, for tracking performance analytics and for marketing purposes. We and some of our third-party providers may use cookie data for various purposes. Please review the cookie settings below and choose your preference.
Used for the proper function of the website
Used for monitoring website traffic and interactions
Cookie Settings
Cookies and similar technologies are used on this website for proper function of the website, for tracking performance analytics and for marketing purposes. We and some of our third-party providers may use cookie data for various purposes. Please review the cookie settings below and choose your preference.
Strictly Necessary: Used for the proper function of the website
Performance/Analytics: Used for monitoring website traffic and interactions
The primary aim is to make sense of the vast amounts of data generated daily by combining statistical analysis, programming, and datavisualization. It is divided into three primary areas: datapreparation, datamodeling, and datavisualization.
These skills include programming languages such as Python and R, statistics and probability, machine learning, datavisualization, and datamodeling. This includes sourcing, gathering, arranging, processing, and modelingdata, as well as being able to analyze large volumes of structured or unstructured data.
Data is an essential component of any business, and it is the role of a data analyst to make sense of it all. Power BI is a powerful datavisualization tool that helps them turn raw data into meaningful insights and actionable decisions. Check out this course and learn Power BI today!
This feature helps automate many parts of the datapreparation and datamodel development process. This significantly reduces the amount of time needed to engage in data science tasks. A text analytics interface that helps derive actionable insights from unstructured data sets.
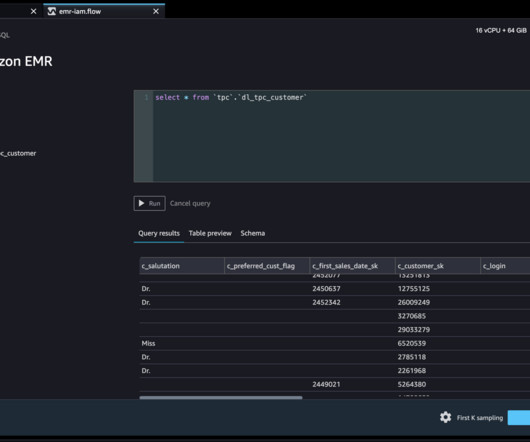
Amazon SageMaker Data Wrangler reduces the time it takes to collect and preparedata for machine learning (ML) from weeks to minutes. We are happy to announce that SageMaker Data Wrangler now supports using Lake Formation with Amazon EMR to provide this fine-grained data access restriction.
Summary: This blog dives into the most promising Power BI projects, exploring advanced datavisualization, AI integration, IoT & blockchain analytics, and emerging technologies. Discover best practices for successful implementation and propel your organization towards data-driven success.
In 2020, we released some of the most highly-anticipated features in Tableau, including dynamic parameters , new datamodeling capabilities , multiple map layers and improved spatial support, predictive modeling functions , and Metrics. We continue to make Tableau more powerful, yet easier to use.
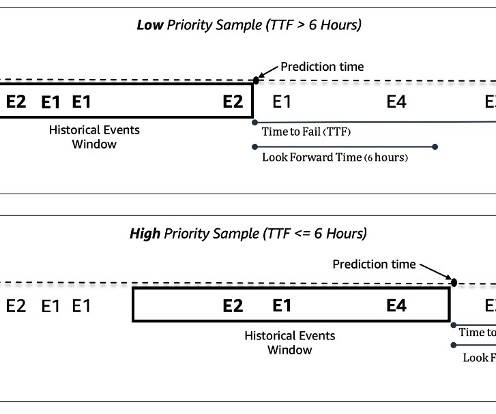
New machines are added continuously to the system, so we had to make sure our model can handle prediction on new machines that have never been seen in training. Data preprocessing and feature engineering In this section, we discuss our methods for datapreparation and feature engineering.
Learn how Data Scientists use ChatGPT, a potent OpenAI language model, to improve their operations. ChatGPT is essential in the domains of natural language processing, modeling, data analysis, data cleaning, and datavisualization. This will enhance the datapreparation stage of machine learning.
In 2020, we released some of the most highly-anticipated features in Tableau, including dynamic parameters , new datamodeling capabilities , multiple map layers and improved spatial support, predictive modeling functions , and Metrics. We continue to make Tableau more powerful, yet easier to use.
GP has intrinsic advantages in datamodeling, given its construction in the framework of Bayesian hierarchical modeling and no requirement for a priori information of function forms in Bayesian reference. Datavisualization charts and plot graphs can be used for this.
Data often arrives from multiple sources in inconsistent forms, including duplicate entries from CRM systems, incomplete spreadsheet records, and mismatched naming conventions across databases. Data […] These issues slow analysis pipelines and demand time-consuming cleanup.
We organize all of the trending information in your field so you don't have to. Join 17,000+ users and stay up to date on the latest articles your peers are reading.
You know about us, now we want to get to know you!
Let's personalize your content
Let's get even more personalized
We recognize your account from another site in our network, please click 'Send Email' below to continue with verifying your account and setting a password.


Let's personalize your content