This site uses cookies to improve your experience. To help us insure we adhere to various privacy regulations, please select your country/region of residence. If you do not select a country, we will assume you are from the United States. Select your Cookie Settings or view our Privacy Policy and Terms of Use.
Cookie Settings
Cookies and similar technologies are used on this website for proper function of the website, for tracking performance analytics and for marketing purposes. We and some of our third-party providers may use cookie data for various purposes. Please review the cookie settings below and choose your preference.
Used for the proper function of the website
Used for monitoring website traffic and interactions
Cookie Settings
Cookies and similar technologies are used on this website for proper function of the website, for tracking performance analytics and for marketing purposes. We and some of our third-party providers may use cookie data for various purposes. Please review the cookie settings below and choose your preference.
Strictly Necessary: Used for the proper function of the website
Performance/Analytics: Used for monitoring website traffic and interactions
Top 10 Professions in Data Science: Below, we provide a list of the top data science careers along with their corresponding salary ranges: 1. Data Scientist Data scientists are responsible for designing and implementing datamodels, analyzing and interpreting data, and communicating insights to stakeholders.
For example, business analysts can use BI dashboards to conduct in-depth business analytics and visualize key performance metrics compiled from relevant datasets. They may also use tools such as Excel to sort, calculate and visualizedata.
But its status as the go-between for programming and data professionals isn’t its only power. Within SQL you can also filter data, aggregate it and create valuations, manipulate data, update it, and even do datamodeling.
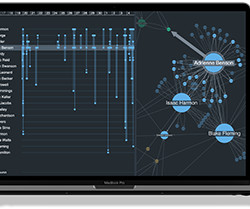
Graph visualization SDKs would have been a huge asset to those projects. To prove this, I built my own digital twin using the KeyLines graph visualization toolkit. Let’s see how advanced datavisualization can illuminate these models and uncover powerful insights. What is a digital twin?
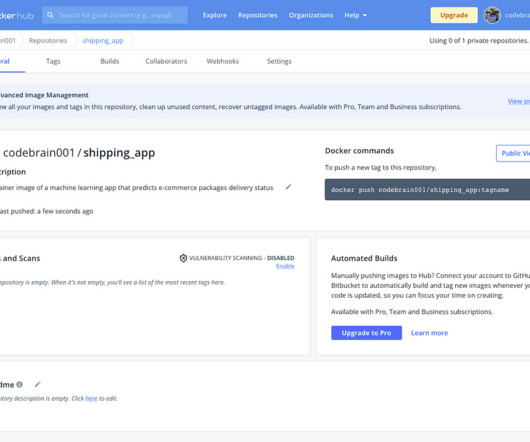
These steps include defining business and project objectives, acquiring and exploring data, modeling the data with various algorithms, interpreting and communicating the project outcome, and implementing and maintaining the project. catboost is the machine learning algorithm for model building. Flask==2.1.2 xgboost==1.6.1
Data often arrives from multiple sources in inconsistent forms, including duplicate entries from CRM systems, incomplete spreadsheet records, and mismatched naming conventions across databases. These issues slow analysis pipelines and demand time-consuming cleanup.
We organize all of the trending information in your field so you don't have to. Join 17,000+ users and stay up to date on the latest articles your peers are reading.
You know about us, now we want to get to know you!
Let's personalize your content
Let's get even more personalized
We recognize your account from another site in our network, please click 'Send Email' below to continue with verifying your account and setting a password.
Let's personalize your content