This site uses cookies to improve your experience. To help us insure we adhere to various privacy regulations, please select your country/region of residence. If you do not select a country, we will assume you are from the United States. Select your Cookie Settings or view our Privacy Policy and Terms of Use.
Cookie Settings
Cookies and similar technologies are used on this website for proper function of the website, for tracking performance analytics and for marketing purposes. We and some of our third-party providers may use cookie data for various purposes. Please review the cookie settings below and choose your preference.
Used for the proper function of the website
Used for monitoring website traffic and interactions
Cookie Settings
Cookies and similar technologies are used on this website for proper function of the website, for tracking performance analytics and for marketing purposes. We and some of our third-party providers may use cookie data for various purposes. Please review the cookie settings below and choose your preference.
Strictly Necessary: Used for the proper function of the website
Performance/Analytics: Used for monitoring website traffic and interactions
Data is an essential component of any business, and it is the role of a data analyst to make sense of it all. PowerBI is a powerfuldatavisualization tool that helps them turn raw data into meaningful insights and actionable decisions.
Summary: Big Datavisualization involves representing large datasets graphically to reveal patterns, trends, and insights that are not easily discernible from raw data. quintillion bytes of data daily, the need for effective visualization techniques has never been greater. As we generate approximately 2.5
Employing an analytical system in a data-driven business can help it to discover useful trends, information, conclusions and elevated decision making. PowerBI proves to be the best tool for analysis and visualization of data. Cloud-based PowerBI technology is a forerunner for corporate executives.
A Data Product can take various forms, depending on the domain’s requirements and the data it manages. It could be a curated dataset, a machine learning model, an API that exposes data, a real-time data stream, a datavisualization dashboard, or any other data-related asset that provides value to the organization.
How to Optimize PowerBI and Snowflake for Advanced Analytics Spencer Baucke May 25, 2023 The world of business intelligence and data modernization has never been more competitive than it is today. Table of Contents Why Discuss Snowflake & PowerBI?
Their role is crucial in understanding the underlying data structures and how to leverage them for insights. Key Skills Proficiency in SQL is essential, along with experience in datavisualization tools such as Tableau or PowerBI.
Summary: This blog dives into the most promising PowerBI projects, exploring advanced datavisualization, AI integration, IoT & blockchain analytics, and emerging technologies. Discover best practices for successful implementation and propel your organization towards data-driven success.
Data Analyst Data Analyst is a featured GPT in the store that specializes in data analysis and visualization. You can upload your data files to this GPT that it can then analyze. Other than the advanced data analysis, it can also deal with image conversions. It is capable of writing and running Python codes.
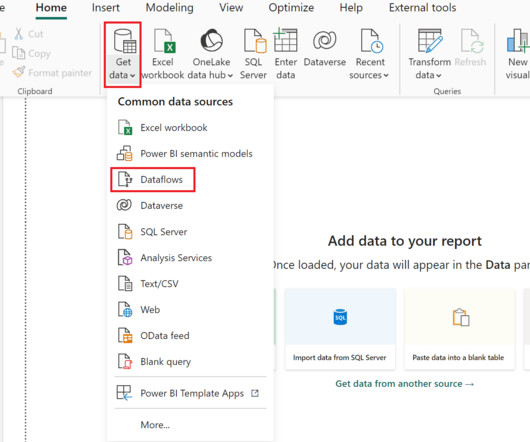
We at phData have written extensively about creating centralized data products in PowerBI. Most PowerBI developers are familiar with Power Query , Which is the data transformation layer of PowerBI. This step can be performed as many times as needed across as many datamodels.
PowerBI Heatmap: Heatmap in PowerBI refers to the type of custom visualisation that businesses analysts utilise for showcasing the relationship between two variables on a map in different colour patches. It offers a wide range of features that make it a popular choice for data professionals, analysts, and organizations.
In the digital era, datavisualization stands as an indispensable tool in the realm of business intelligence. It represents the graphical display of data and information, transforming complex datasets into intuitive and understandable visuals.
Data Analyst Data Analyst is a featured GPT in the store that specializes in data analysis and visualization. You can upload your data files to this GPT that it can then analyze. Other than the advanced data analysis, it can also deal with image conversions. It is capable of writing and running Python codes.
Data Analyst Data Analyst is a featured GPT in the store that specializes in data analysis and visualization. You can upload your data files to this GPT that it can then analyze. Other than the advanced data analysis, it can also deal with image conversions. It is capable of writing and running Python codes.
There is a plethora of BI tools available in the market today, with new ones being added yearly. Through a comparative analysis of some of the leading BI tools: Google Looker, Microsoft PowerBI, Tableau and Qlik Sense, discover which BI solution best fits your organization’s data analytics needs to empower informed decision-making.
Summary: Business Intelligence Analysts transform raw data into actionable insights. They use tools and techniques to analyse data, create reports, and support strategic decisions. Key skills include SQL, datavisualization, and business acumen. Introduction We are living in an era defined by data.
Business Intelligence tools encompass a variety of software applications designed to collect, process, analyse, and present business data. These tools enable organizations to convert raw data into actionable insights through various means such as reporting, analytics, datavisualization, and performance management.
It is the process of converting raw data into relevant and practical knowledge to help evaluate the performance of businesses, discover trends, and make well-informed choices. Data gathering, data integration, datamodelling, analysis of information, and datavisualization are all part of intelligence for businesses.
To pursue a data science career, you need a deep understanding and expansive knowledge of machine learning and AI. js and Tableau Data science, data analytics and IBM Practicing data science isn’t without its challenges.
But its status as the go-between for programming and data professionals isn’t its only power. Within SQL you can also filter data, aggregate it and create valuations, manipulate data, update it, and even do datamodeling. One set of tools that are becoming more important in our data-driven world is BI tools.
Proficient in programming languages like Python or R, data manipulation libraries like Pandas, and machine learning frameworks like TensorFlow and Scikit-learn, data scientists uncover patterns and trends through statistical analysis and datavisualization. DataVisualization: Matplotlib, Seaborn, Tableau, etc.
Tableau is an interactive platform that enables users to analyse and visualise data to gain insights. How Professionals Can Use Tableau for Data Science? Tableau is a powerfuldatavisualization and business intelligence tool that can be effectively used by professionals in the field of data science.
They are useful for big data analytics where flexibility is needed. DataModelingDatamodeling involves creating logical structures that define how data elements relate to each other. This includes: Dimensional Modeling : Organizes data into dimensions (e.g., time, product) and facts (e.g.,
Some of the common career opportunities in BI include: Entry-level roles Data analyst: A data analyst is responsible for collecting and analyzing data, creating reports, and presenting insights to stakeholders. They may also be involved in datamodeling and database design.
Some of the common career opportunities in BI include: Entry-level roles Data analyst: A data analyst is responsible for collecting and analyzing data, creating reports, and presenting insights to stakeholders. They may also be involved in datamodeling and database design.
Knowledge of Core Data Engineering Concepts Ensure one possess a strong foundation in core data engineering concepts, which include data structures, algorithms, database management systems, datamodeling , data warehousing , ETL (Extract, Transform, Load) processes, and distributed computing frameworks (e.g.,
Because they are the most likely to communicate data insights, they’ll also need to know SQL, and visualization tools such as PowerBI and Tableau as well. Machine Learning Engineer Machine learning engineers will use data much differently than business analysts or data analysts.
Summary: Struggling to translate data into clear stories? This datavisualization tool empowers Data Analysts with drag-and-drop simplicity, interactive dashboards, and a wide range of visualizations. With this course, you will learn about Python, Tableau, PowerBI, Matplolib and more.
Before we dive right in, you’d totally love to check out the deliverables that came with this project (a PowerPoint presentation and a very insightful PowerBI dashboard). And I hope that after you’ve gone through my presentation here , you’ll want to invest in Data Bank. See the links below! Now, let’s get started. ?
Apache Airflow Apache Airflow is a workflow automation tool that allows data engineers to schedule, monitor, and manage data pipelines efficiently. It helps streamline data processing tasks and ensures reliable execution. It helps organisations understand their data better and make informed decisions.
We organize all of the trending information in your field so you don't have to. Join 17,000+ users and stay up to date on the latest articles your peers are reading.
You know about us, now we want to get to know you!
Let's personalize your content
Let's get even more personalized
We recognize your account from another site in our network, please click 'Send Email' below to continue with verifying your account and setting a password.


Let's personalize your content