This site uses cookies to improve your experience. To help us insure we adhere to various privacy regulations, please select your country/region of residence. If you do not select a country, we will assume you are from the United States. Select your Cookie Settings or view our Privacy Policy and Terms of Use.
Cookie Settings
Cookies and similar technologies are used on this website for proper function of the website, for tracking performance analytics and for marketing purposes. We and some of our third-party providers may use cookie data for various purposes. Please review the cookie settings below and choose your preference.
Used for the proper function of the website
Used for monitoring website traffic and interactions
Cookie Settings
Cookies and similar technologies are used on this website for proper function of the website, for tracking performance analytics and for marketing purposes. We and some of our third-party providers may use cookie data for various purposes. Please review the cookie settings below and choose your preference.
Strictly Necessary: Used for the proper function of the website
Performance/Analytics: Used for monitoring website traffic and interactions
Summary: Big Datavisualization involves representing large datasets graphically to reveal patterns, trends, and insights that are not easily discernible from raw data. quintillion bytes of data daily, the need for effective visualization techniques has never been greater. As we generate approximately 2.5
Ateken Abla March 19, 2024 - 9:05pm Larissa Amoroso Vice President, Tableau Community, Tableau When Karolina Grodzinska took the stage at Tableau Conference as part of her Iron Viz: Student Edition award, it felt like the culmination of her data learning, which started in 2021. How did Karolina discover Tableau? “It
Technical Fellow, Tableau. Innovation is necessary to use data effectively in the pursuit of a better world, particularly because data continues to increase in size and richness. I am proud to announce that my History of Tableau Innovation viz is now published to Tableau Public. Jock Mackinlay. Bronwen Boyd.
Chief Product Officer, Tableau. It's more important than ever in this all digital, work from anywhere world for organizations to use data to make informed decisions. However, most organizations struggle to become data driven. With Tableau, any user can visually explore that data in real time.
Their role is crucial in understanding the underlying data structures and how to leverage them for insights. Key Skills Proficiency in SQL is essential, along with experience in datavisualization tools such as Tableau or Power BI.
A Data Product can take various forms, depending on the domain’s requirements and the data it manages. It could be a curated dataset, a machine learning model, an API that exposes data, a real-time data stream, a datavisualization dashboard, or any other data-related asset that provides value to the organization.
Data engineering tools offer a range of features and functionalities, including data integration, data transformation, data quality management, workflow orchestration, and datavisualization. Essential data engineering tools for 2023 Top 10 data engineering tools to watch out for in 2023 1.
Technical Fellow, Tableau. Innovation is necessary to use data effectively in the pursuit of a better world, particularly because data continues to increase in size and richness. I am proud to announce that my History of Tableau Innovation viz is now published to Tableau Public. Jock Mackinlay. Bronwen Boyd.
Senior Vice President, Product Marketing, Tableau. Every company today is being asked to do more with less, and leaders need access to fresh, trusted KPIs and data-driven insights to manage their businesses, keep ahead of the competition, and provide unparalleled customer experiences. . All your customer data is instantly accessible.
Senior Vice President, Product Marketing, Tableau. Every company today is being asked to do more with less, and leaders need access to fresh, trusted KPIs and data-driven insights to manage their businesses, keep ahead of the competition, and provide unparalleled customer experiences. . All your customer data is instantly accessible.
Skills for data analysts 2023 10 essential skills for data analysts to have in 2023 Here are 10 essential skills for data analysts to have in 2023: 1. DataVisualization: Topping the list of skills for data analysts datavisualization stands first.
Chief Product Officer, Tableau. It's more important than ever in this all digital, work from anywhere world for organizations to use data to make informed decisions. However, most organizations struggle to become data driven. With Tableau, any user can visually explore that data in real time.
Gartner has again recognized Tableau as a Leader—for our ninth consecutive year. . I first want to thank you, the Tableau Community, for your continued support and your commitment to data, to Tableau, and to each other. With your input, we released more than 200 new capabilities across the Tableau platform in 2020.
Danika Harrod December 20, 2024 - 10:44pm Dan Jewett Senior Vice President of Product Management As 2024 draws to a close, we want to express our heartfelt gratitude to the incredible Tableau Community. Its your feedback and collaboration that help us push the boundaries of whats possible in datavisualization and analytics.
Summary: Tableau is fantastic for datavisualization, but understanding your data is key. Data types in Tableau act like labels, telling Tableau if it’s a number for calculations, text for labels, or a date for trends. Using the right type ensures accuracy and avoids misleading visuals.
Tableau is a data visualisation software helping you to generate graphics-rich reporting and analysing enormous volumes of data. With the help of Tableau, organisations have been able to mine and gather actionable insights from granular sources of data. Let’s read the blog to find out!
If you occasionally run business stands in fairs, congresses and exhibitions, business stands designers can incorporate business intelligence to aid in better business and client data collection. Business intelligence tools can include data warehousing, datavisualizations, dashboards, and reporting.
Spencer Czapiewski Southard Jones Chief Product Officer, Tableau Since the announcement of Tableau Next (formerly Tableau Einstein), we've been thrilled by all the enthusiasm and curiosity from our community, customers, and partners. What is Tableau Next and why now?
Spencer Czapiewski October 8, 2024 - 9:14pm Southard Jones Chief Product Officer, Tableau Since the announcement of Tableau Einstein, we've been thrilled by all the enthusiasm and curiosity from our community, customers, and partners. What is Tableau Einstein and why now?
Summary: Struggling to translate data into clear stories? Tableau can help! This datavisualization tool empowers Data Analysts with drag-and-drop simplicity, interactive dashboards, and a wide range of visualizations. What are The Benefits of Learning Tableau for Data Analysts?
Allison (Ally) Witherspoon Johnston Senior Vice President, Product Marketing, Tableau Bronwen Boyd December 7, 2022 - 11:16pm February 14, 2023 In the quest to become a customer-focused company, the ability to quickly act on insights and deliver personalized customer experiences has never been more important. Up to date. Let’s explore how.
Gartner has again recognized Tableau as a Leader—for our ninth consecutive year. . I first want to thank you, the Tableau Community, for your continued support and your commitment to data, to Tableau, and to each other. With your input, we released more than 200 new capabilities across the Tableau platform in 2020.
Through a comparative analysis of some of the leading BI tools: Google Looker, Microsoft Power BI, Tableau and Qlik Sense, discover which BI solution best fits your organization’s data analytics needs to empower informed decision-making. It allows users to create highly customizable and visually appealing reports.
Summary: Business Intelligence Analysts transform raw data into actionable insights. They use tools and techniques to analyse data, create reports, and support strategic decisions. Key skills include SQL, datavisualization, and business acumen. Introduction We are living in an era defined by data.
Two of the platforms that we see emerging as a popular combination of data warehousing and business intelligence are the Snowflake Data Cloud and Power BI. Debuting in 2015, Power BI has undergone meaningful updates that have made it a leader not just in datavisualization, but in the business intelligence space as well.
It is the process of converting raw data into relevant and practical knowledge to help evaluate the performance of businesses, discover trends, and make well-informed choices. Data gathering, data integration, datamodelling, analysis of information, and datavisualization are all part of intelligence for businesses.
Business Intelligence tools encompass a variety of software applications designed to collect, process, analyse, and present business data. These tools enable organizations to convert raw data into actionable insights through various means such as reporting, analytics, datavisualization, and performance management.
js and TableauData science, data analytics and IBM Practicing data science isn’t without its challenges. There can be fragmented data, a short supply of data science skills and rigid IT standards for training and deployment.
Architecturally the introduction of Hadoop, a file system designed to store massive amounts of data, radically affected the cost model of data. Organizationally the innovation of self-service analytics, pioneered by Tableau and Qlik, fundamentally transformed the user model for data analysis.
Proficient in programming languages like Python or R, data manipulation libraries like Pandas, and machine learning frameworks like TensorFlow and Scikit-learn, data scientists uncover patterns and trends through statistical analysis and datavisualization. DataVisualization: Matplotlib, Seaborn, Tableau, etc.
Some of the common career opportunities in BI include: Entry-level roles Data analyst: A data analyst is responsible for collecting and analyzing data, creating reports, and presenting insights to stakeholders. They may also be involved in datamodeling and database design.
Some of the common career opportunities in BI include: Entry-level roles Data analyst: A data analyst is responsible for collecting and analyzing data, creating reports, and presenting insights to stakeholders. They may also be involved in datamodeling and database design.
But its status as the go-between for programming and data professionals isn’t its only power. Within SQL you can also filter data, aggregate it and create valuations, manipulate data, update it, and even do datamodeling. One set of tools that are becoming more important in our data-driven world is BI tools.
They are useful for big data analytics where flexibility is needed. DataModelingDatamodeling involves creating logical structures that define how data elements relate to each other. This includes: Dimensional Modeling : Organizes data into dimensions (e.g., time, product) and facts (e.g.,
Knowledge of Core Data Engineering Concepts Ensure one possess a strong foundation in core data engineering concepts, which include data structures, algorithms, database management systems, datamodeling , data warehousing , ETL (Extract, Transform, Load) processes, and distributed computing frameworks (e.g.,
Because they are the most likely to communicate data insights, they’ll also need to know SQL, and visualization tools such as Power BI and Tableau as well. Machine Learning Engineer Machine learning engineers will use data much differently than business analysts or data analysts.
Technologies, tools, and methodologies Imagine Data Intelligence as a toolbox filled with gadgets for every analytical need. From powerful analytics software to Machine Learning algorithms, these tools transform data into actionable intelligence. 9,43,649 Business acumen, Data Visualisation tools (e.g.,
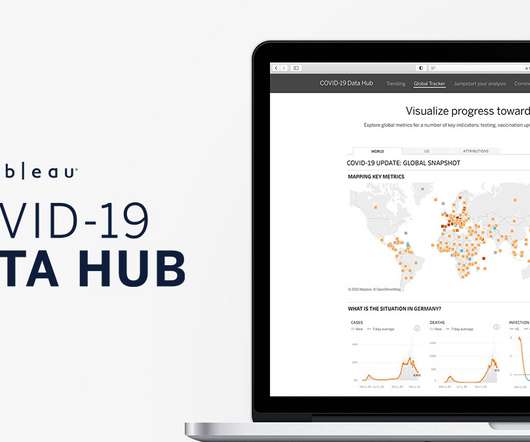
Director, Tableau. Today, on the Tableau COVID-19 Data Hub , we launch a new Global Tracker that combines and visualizes the key metrics that measure our return to normalcy. The evolution of the Tableau COVID-19 Global Tracker. How we choose data sources for the new Global Tracker. Jeremy Blaney.
Director, Tableau. Today, on the Tableau COVID-19 Data Hub , we launch a new Global Tracker that combines and visualizes the key metrics that measure our return to normalcy. The evolution of the Tableau COVID-19 Global Tracker. How we choose data sources for the new Global Tracker. Jeremy Blaney.
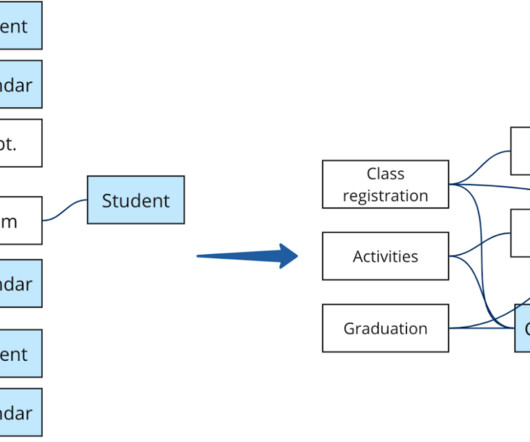
This article was co-written by Manish Garg & Hakeem Lawrence A common challenge with many business intelligence tools is building trust, often when there isn’t a datamodel and when various BI tools throughout the organization provide conflicting results. What Can You Do With Omni?
Apache Airflow Apache Airflow is a workflow automation tool that allows data engineers to schedule, monitor, and manage data pipelines efficiently. It helps streamline data processing tasks and ensures reliable execution. It helps organisations understand their data better and make informed decisions.
We organize all of the trending information in your field so you don't have to. Join 17,000+ users and stay up to date on the latest articles your peers are reading.
You know about us, now we want to get to know you!
Let's personalize your content
Let's get even more personalized
We recognize your account from another site in our network, please click 'Send Email' below to continue with verifying your account and setting a password.


Let's personalize your content