This site uses cookies to improve your experience. To help us insure we adhere to various privacy regulations, please select your country/region of residence. If you do not select a country, we will assume you are from the United States. Select your Cookie Settings or view our Privacy Policy and Terms of Use.
Cookie Settings
Cookies and similar technologies are used on this website for proper function of the website, for tracking performance analytics and for marketing purposes. We and some of our third-party providers may use cookie data for various purposes. Please review the cookie settings below and choose your preference.
Used for the proper function of the website
Used for monitoring website traffic and interactions
Cookie Settings
Cookies and similar technologies are used on this website for proper function of the website, for tracking performance analytics and for marketing purposes. We and some of our third-party providers may use cookie data for various purposes. Please review the cookie settings below and choose your preference.
Strictly Necessary: Used for the proper function of the website
Performance/Analytics: Used for monitoring website traffic and interactions
Data is an essential component of any business, and it is the role of a data analyst to make sense of it all. PowerBI is a powerfuldata visualization tool that helps them turn raw data into meaningful insights and actionable decisions.
When thinking about PowerBI , the platform’s visuals and report side immediately come to mind. While the front-end report visuals are important and the most visible to end users, a lot goes on behind the scenes that contribute heavily to the end product, including datamodeling. What is DataModeling?
It offers full BI-Stack Automation, from source to data warehouse through to frontend. It supports a holistic datamodel, allowing for rapid prototyping of various models. It also supports a wide range of data warehouses, analytical databases, data lakes, frontends, and pipelines/ETL.
How to Optimize PowerBI and Snowflake for Advanced Analytics Spencer Baucke May 25, 2023 The world of business intelligence and data modernization has never been more competitive than it is today. Table of Contents Why Discuss Snowflake & PowerBI?
Top Employers Microsoft, Facebook, and consulting firms like Accenture are actively hiring in this field of remote data science jobs, with salaries generally ranging from $95,000 to $140,000. Key Skills Proficiency in SQL is essential, along with experience in data visualization tools such as Tableau or PowerBI.
In addition to Business Intelligence (BI), Process Mining is no longer a new phenomenon, but almost all larger companies are conducting this data-driven process analysis in their organization. This aspect can be applied well to Process Mining, hand in hand with BI and AI. I did not call it object-centric but dynamic datamodel.
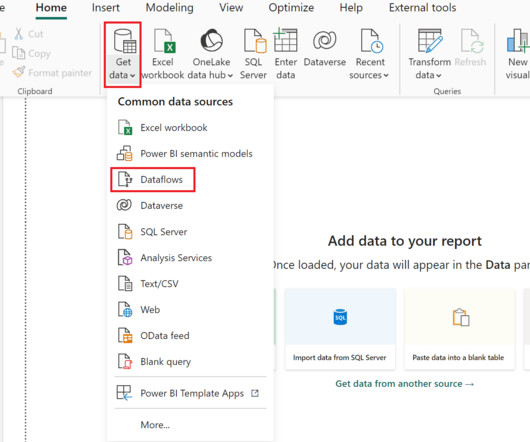
PowerBI Desktop enables the connection and retrieval of data from various sources, followed by data transformation using Power Query. To address this challenge, Microsoft introduced Dataflows within the PowerBI service. What are Dataflows in PowerBI?
The Datamarts capability opens endless possibilities for organizations to achieve their data analytics goals on the PowerBI platform. Before we look into the PowerBI Datamarts, let us take a step back and understand the meaning of a Datamart. in an enterprise data warehouse. What is PowerBI Datamarts?
Summary: PowerBI is a business analytics tool transforming data into actionable insights. Key features include AI-powered analytics, extensive data connectivity, customisation options, and robust datamodelling. Customisable dashboards and reports enhance data presentation. Why PowerBI?
Summary: PowerBI is a leading data analytics platform offering advanced features like real-time analytics and collaborative capabilities. Understanding its significance is vital for aspiring PowerBI developers. Mastering PowerBI can significantly enhance career prospects, given its prevalence in the industry.
We at phData have written extensively about creating centralized data products in PowerBI. Most PowerBI developers are familiar with Power Query , Which is the data transformation layer of PowerBI. Second, it drives up consumption or compute resources in your database.
This capability, rooted in the sophisticated world of Natural Language Processing (NLP), removes the barriers that often complicate data retrieval and analysis, making insights accessible to everyone, regardless of their technical expertise. What is Natural Language Query (NLQ)?
Diagrams ⚡PRO BUILDER⚡ The Diagrams Pro Builder excels at visualizing codes and databases. It is capable of understanding complex relationships in data and creating visual outputs in the form of flowcharts, charts, and sequences. Other outputs include database diagrams and code visualizations.
PowerBI Heatmap: Heatmap in PowerBI refers to the type of custom visualisation that businesses analysts utilise for showcasing the relationship between two variables on a map in different colour patches. It offers a wide range of features that make it a popular choice for data professionals, analysts, and organizations.
Summary: PowerBI alternatives like Tableau, Qlik Sense, and Zoho Analytics provide businesses with tailored Data Analysis and Visualisation solutions. Selecting the right alternative ensures efficient data-driven decision-making and aligns with your organisation’s goals and budget. What is PowerBI?
Using pre-production data during the development process of building a PowerBI dashboard is considered a best practice. Doing so avoids straining your production data environment and reserves those resources for dashboards that are actually being used by end-users. What can a Parameter for your Data Source Accomplish?
PowerBI Datamarts is one of the most exciting features that Microsoft has released for the Power Platform in recent years. If you need high-level information on what a PowerBI Datamart is and some example use cases, check out our other blog, What Are PowerBI Datamarts?
It allows users to create interactive and shareable dashboards that visualise data in a variety of formats. Wide Range of Data Sources : Connects to databases, spreadsheets, and Big Data platforms. Advanced Analytics : Offers capabilities for data cleaning, transformation, and custom calculations.
There is a plethora of BI tools available in the market today, with new ones being added yearly. Through a comparative analysis of some of the leading BI tools: Google Looker, Microsoft PowerBI, Tableau and Qlik Sense, discover which BI solution best fits your organization’s data analytics needs to empower informed decision-making.
Diagrams ⚡PRO BUILDER⚡ The Diagrams Pro Builder excels at visualizing codes and databases. It is capable of understanding complex relationships in data and creating visual outputs in the form of flowcharts, charts, and sequences. Other outputs include database diagrams and code visualizations.
Diagrams ⚡PRO BUILDER⚡ The Diagrams Pro Builder excels at visualizing codes and databases. It is capable of understanding complex relationships in data and creating visual outputs in the form of flowcharts, charts, and sequences. Other outputs include database diagrams and code visualizations.
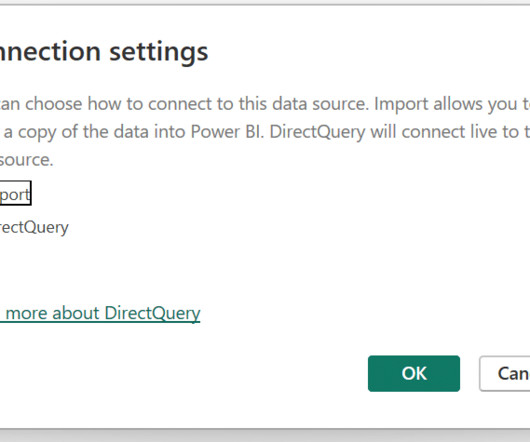
When connecting to data in PowerBI, you need to choose whether you want to use Import or Direct Query mode to connect to your data. Using the Import method, PowerBI captures and caches a snapshot of your data in PowerBI. What is PowerBI Direct Query?
It’s a foundational skill for working with relational databases Just about every data scientist or analyst will have to work with relational databases in their careers. So by learning to use SQL, you’ll write efficient and effective queries, as well as understand how the data is structured and stored.
It is the process of converting raw data into relevant and practical knowledge to help evaluate the performance of businesses, discover trends, and make well-informed choices. Data gathering, data integration, datamodelling, analysis of information, and data visualization are all part of intelligence for businesses.
These tools enable organizations to convert raw data into actionable insights through various means such as reporting, analytics, data visualization, and performance management. Data Processing: Cleaning and organizing data for analysis.
Essentially, BI bridges the gap between raw data and actionable knowledge. It gathers information from various sources sales databases, marketing platforms, customer feedback, and more and consolidates it into a unified view. Ensuring data accuracy and consistency through cleansing and validation processes.
To pursue a data science career, you need a deep understanding and expansive knowledge of machine learning and AI. And you should have experience working with big data platforms such as Hadoop or Apache Spark. Data scientists will typically perform data analytics when collecting, cleaning and evaluating data.
Some of the common career opportunities in BI include: Entry-level roles Data analyst: A data analyst is responsible for collecting and analyzing data, creating reports, and presenting insights to stakeholders. They may also be involved in datamodeling and database design.
Some of the common career opportunities in BI include: Entry-level roles Data analyst: A data analyst is responsible for collecting and analyzing data, creating reports, and presenting insights to stakeholders. They may also be involved in datamodeling and database design.
The starting range for a SQL Data Analyst is $61,128 per annum. How SQL Important in Data Analytics? Sincerely, SQL is used by Data Analysts for storing data in a particular type of Database and ensures flexibility in accessing or updating data. An SQL Data Analyst is vital for an organisation.
They encompass all the origins from which data is collected, including: Internal Data Sources: These include databases, enterprise resource planning (ERP) systems, customer relationship management (CRM) systems, and flat files within an organization. Data can be structured (e.g., databases), semi-structured (e.g.,
Data engineers are essential professionals responsible for designing, constructing, and maintaining an organization’s data infrastructure. They create data pipelines, ETL processes, and databases to facilitate smooth data flow and storage. Data Warehousing: Amazon Redshift, Google BigQuery, etc.
Because they are the most likely to communicate data insights, they’ll also need to know SQL, and visualization tools such as PowerBI and Tableau as well. Machine Learning Engineer Machine learning engineers will use data much differently than business analysts or data analysts.
Hierarchies align datamodelling with business processes, making it easier to analyse data in a context that reflects real-world operations. Designing Hierarchies Designing effective hierarchies requires careful consideration of the business requirements and the datamodel.
Tableau is an interactive platform that enables users to analyse and visualise data to gain insights. Consequently, if your results, scores, etc are stored in an SQL Database, Tableau can be able to quickly visualise easily your model metrics. With SQL queries Tableau helps in integrating with them effectively.
Knowledge of Core Data Engineering Concepts Ensure one possess a strong foundation in core data engineering concepts, which include data structures, algorithms, database management systems, datamodeling , data warehousing , ETL (Extract, Transform, Load) processes, and distributed computing frameworks (e.g.,
These tools enable effective data structuring, transformation, and analysis, supporting best practices for dimensional modelling and ensuring high-quality, consistent business metrics. These tools are essential for populating fact tables with accurate and timely data.
Before we dive right in, you’d totally love to check out the deliverables that came with this project (a PowerPoint presentation and a very insightful PowerBI dashboard). Entity Relationship Diagram Before we dive into the analysis, let’s take a moment to understand the different tables that were eventually created in the database.
Perform data transformations, such as merging, filtering, and aggregating dataData Analysis and Modeling Analyze data using statistical techniques, data mining, and predictive modeling. With this course, you will learn about Python, Tableau, PowerBI, Matplolib and more.
OnPrem - Geospatial database D2. OnPrem - SAP database D4. OnCloud - Large mirror database D10. OnPrem - LotusNotes database D11. OnPrem - IBM BPM database D12. Looks like the only automation platforms which can connect to all the data sources we need is VBA and Powershell. OnCloud - Geospatial mirror D3.
Introduction MongoDB is a robust NoSQL database, crucial in today’s data-driven tech industry. Preparing for MongoDB interviews is essential for aspiring developers and data professionals. Read Blogs: Crucial Statistics Interview Questions for Data Science Success. Python Interview Questions And Answers.
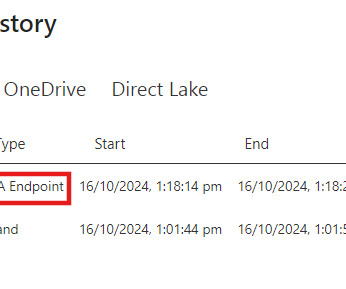
We all know how easy it is to refresh a single table in PowerBI Desktop by right-clicking the table and selecting Refresh Data. However, in PowerBI Service, we can only refresh the entire semantic model, as there is no out-of-the-box solution for refreshing a single table.
Without data engineering , companies would struggle to analyse information and make informed decisions. What Does a Data Engineer Do? A data engineer creates and manages the pipelines that transfer data from different sources to databases or cloud storage. How is Data Engineering Different from Data Science?
We organize all of the trending information in your field so you don't have to. Join 17,000+ users and stay up to date on the latest articles your peers are reading.
You know about us, now we want to get to know you!
Let's personalize your content
Let's get even more personalized
We recognize your account from another site in our network, please click 'Send Email' below to continue with verifying your account and setting a password.


Let's personalize your content