This site uses cookies to improve your experience. To help us insure we adhere to various privacy regulations, please select your country/region of residence. If you do not select a country, we will assume you are from the United States. Select your Cookie Settings or view our Privacy Policy and Terms of Use.
Cookie Settings
Cookies and similar technologies are used on this website for proper function of the website, for tracking performance analytics and for marketing purposes. We and some of our third-party providers may use cookie data for various purposes. Please review the cookie settings below and choose your preference.
Used for the proper function of the website
Used for monitoring website traffic and interactions
Cookie Settings
Cookies and similar technologies are used on this website for proper function of the website, for tracking performance analytics and for marketing purposes. We and some of our third-party providers may use cookie data for various purposes. Please review the cookie settings below and choose your preference.
Strictly Necessary: Used for the proper function of the website
Performance/Analytics: Used for monitoring website traffic and interactions
It offers full BI-Stack Automation, from source to data warehouse through to frontend. It supports a holistic datamodel, allowing for rapid prototyping of various models. It also supports a wide range of data warehouses, analytical databases, data lakes, frontends, and pipelines/ETL.
Technical Fellow, Tableau. Innovation is necessary to use data effectively in the pursuit of a better world, particularly because data continues to increase in size and richness. I am proud to announce that my History of Tableau Innovation viz is now published to Tableau Public. Jock Mackinlay. Bronwen Boyd.
Top Employers Microsoft, Facebook, and consulting firms like Accenture are actively hiring in this field of remote data science jobs, with salaries generally ranging from $95,000 to $140,000. Their role is crucial in understanding the underlying data structures and how to leverage them for insights.
Chief Product Officer, Tableau. It's more important than ever in this all digital, work from anywhere world for organizations to use data to make informed decisions. However, most organizations struggle to become data driven. With Tableau, any user can visually explore that data in real time. Francois Ajenstat.
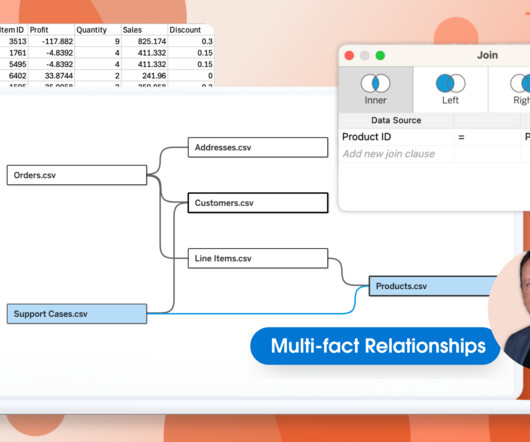
Spencer Czapiewski August 29, 2024 - 9:52pm Kirk Munroe Chief Analytics Officer & Founding Partner at Paint with Data Kirk Munroe, Chief Analytics Officer and Founding Partner at Paint with Data and Tableau DataDev Ambassador, explains the value of using relationships in your Tableaudatamodels.
In addition to Business Intelligence (BI), Process Mining is no longer a new phenomenon, but almost all larger companies are conducting this data-driven process analysis in their organization. The Event Log DataModel for Process Mining Process Mining as an analytical system can very well be imagined as an iceberg.
Madeleine Corneli Senior Manager, Product Management, Tableau Adiascar Cisneros Manager, Product Management, Tableau Bronwen Boyd April 3, 2023 - 5:27pm April 3, 2023 Google Cloud’s BigQuery is a serverless, highly-scalable cloud-based data warehouse solution that allows users to store, query, and analyze large datasets quickly.
Technical Fellow, Tableau. Innovation is necessary to use data effectively in the pursuit of a better world, particularly because data continues to increase in size and richness. I am proud to announce that my History of Tableau Innovation viz is now published to Tableau Public. Jock Mackinlay. Bronwen Boyd.
Chief Product Officer, Tableau. It's more important than ever in this all digital, work from anywhere world for organizations to use data to make informed decisions. However, most organizations struggle to become data driven. With Tableau, any user can visually explore that data in real time. Francois Ajenstat.
Gartner has again recognized Tableau as a Leader—for our ninth consecutive year. . I first want to thank you, the Tableau Community, for your continued support and your commitment to data, to Tableau, and to each other. With your input, we released more than 200 new capabilities across the Tableau platform in 2020.
While the front-end report visuals are important and the most visible to end users, a lot goes on behind the scenes that contribute heavily to the end product, including datamodeling. In this blog, we’ll describe datamodeling and its significance in Power BI. What is DataModeling?
VP, Product Management, Tableau. When you work in IT, you see first hand how the increasing business appetite for data stresses existing systems—and even in-flight digital transformations. Data fabric governance assumes a federated environment, so they scale by connecting to new data sources as they emerge. Volker Metten.
VP, Product Management, Tableau. When you work in IT, you see first hand how the increasing business appetite for data stresses existing systems—and even in-flight digital transformations. Data fabric governance assumes a federated environment, so they scale by connecting to new data sources as they emerge. Volker Metten.
Summary: Struggling to translate data into clear stories? Tableau can help! This data visualization tool empowers Data Analysts with drag-and-drop simplicity, interactive dashboards, and a wide range of visualizations. What are The Benefits of Learning Tableau for Data Analysts?
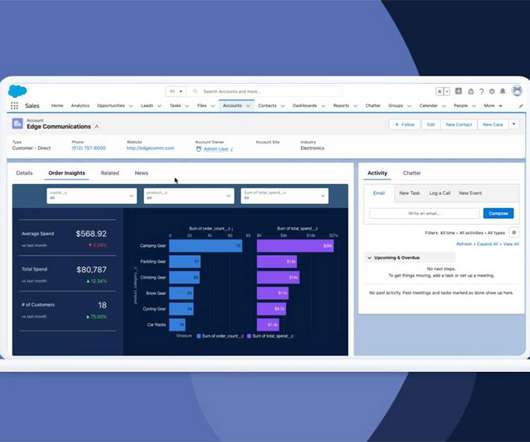
The ability to combine data generated by customer interactions helps organizations better anticipate needs and deliver more integrated and personalized experiences. Businesses meet their customer needs every day using Salesforce CDP and Tableau CRM (TCRM). Tableau CRM can then build and deploy insights to empower organizations.
The ability to combine data generated by customer interactions helps organizations better anticipate needs and deliver more integrated and personalized experiences. Businesses meet their customer needs every day using Salesforce CDP and Tableau CRM (TCRM). Tableau CRM can then build and deploy insights to empower organizations.
Tableau is a data visualisation software helping you to generate graphics-rich reporting and analysing enormous volumes of data. With the help of Tableau, organisations have been able to mine and gather actionable insights from granular sources of data. Let’s read the blog to find out!
Madeleine Corneli Senior Manager, Product Management, Tableau Adiascar Cisneros Manager, Product Management, Tableau Bronwen Boyd April 3, 2023 - 5:27pm April 3, 2023 Google Cloud’s BigQuery is a serverless, highly-scalable cloud-based data warehouse solution that allows users to store, query, and analyze large datasets quickly.
Gartner has again recognized Tableau as a Leader—for our ninth consecutive year. . I first want to thank you, the Tableau Community, for your continued support and your commitment to data, to Tableau, and to each other. With your input, we released more than 200 new capabilities across the Tableau platform in 2020.
With the right tools, organisations can transform raw data into meaningful insights that drive decision-making. This guide explores some of the most effective tools available for Big Data visualization, highlighting their features, benefits, and ideal use cases.
Through a comparative analysis of some of the leading BI tools: Google Looker, Microsoft Power BI, Tableau and Qlik Sense, discover which BI solution best fits your organization’s data analytics needs to empower informed decision-making. Selecting the right one can seem daunting.
It’s a foundational skill for working with relational databases Just about every data scientist or analyst will have to work with relational databases in their careers. So by learning to use SQL, you’ll write efficient and effective queries, as well as understand how the data is structured and stored.
Essentially, BI bridges the gap between raw data and actionable knowledge. It gathers information from various sources sales databases, marketing platforms, customer feedback, and more and consolidates it into a unified view. Ensuring data accuracy and consistency through cleansing and validation processes.
It is the process of converting raw data into relevant and practical knowledge to help evaluate the performance of businesses, discover trends, and make well-informed choices. Data gathering, data integration, datamodelling, analysis of information, and data visualization are all part of intelligence for businesses.
Having gone public in 2020 with the largest tech IPO in history, Snowflake continues to grow rapidly as organizations move to the cloud for their data warehousing needs. Importing data allows you to ingest a copy of the source data into an in-memory database.
And you should have experience working with big data platforms such as Hadoop or Apache Spark. Additionally, data science requires experience in SQL database coding and an ability to work with unstructured data of various types, such as video, audio, pictures and text.
These tools enable organizations to convert raw data into actionable insights through various means such as reporting, analytics, data visualization, and performance management. Data Processing: Cleaning and organizing data for analysis.
Some of the common career opportunities in BI include: Entry-level roles Data analyst: A data analyst is responsible for collecting and analyzing data, creating reports, and presenting insights to stakeholders. They may also be involved in datamodeling and database design.
Some of the common career opportunities in BI include: Entry-level roles Data analyst: A data analyst is responsible for collecting and analyzing data, creating reports, and presenting insights to stakeholders. They may also be involved in datamodeling and database design.
Summary: Power BI alternatives like Tableau, Qlik Sense, and Zoho Analytics provide businesses with tailored Data Analysis and Visualisation solutions. Selecting the right alternative ensures efficient data-driven decision-making and aligns with your organisation’s goals and budget.
Data engineers are essential professionals responsible for designing, constructing, and maintaining an organization’s data infrastructure. They create data pipelines, ETL processes, and databases to facilitate smooth data flow and storage. Data Visualization: Matplotlib, Seaborn, Tableau, etc.
The starting range for a SQL Data Analyst is $61,128 per annum. How SQL Important in Data Analytics? Sincerely, SQL is used by Data Analysts for storing data in a particular type of Database and ensures flexibility in accessing or updating data. An SQL Data Analyst is vital for an organisation.
They encompass all the origins from which data is collected, including: Internal Data Sources: These include databases, enterprise resource planning (ERP) systems, customer relationship management (CRM) systems, and flat files within an organization. Data can be structured (e.g., databases), semi-structured (e.g.,
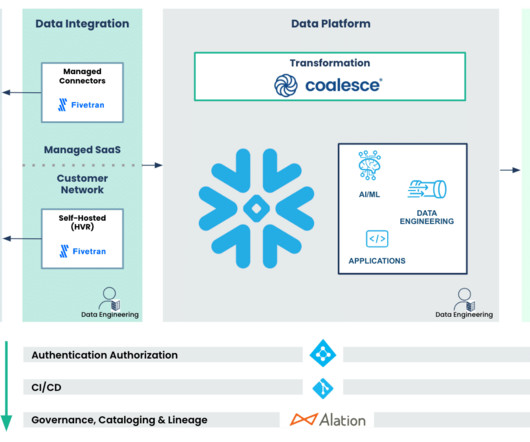
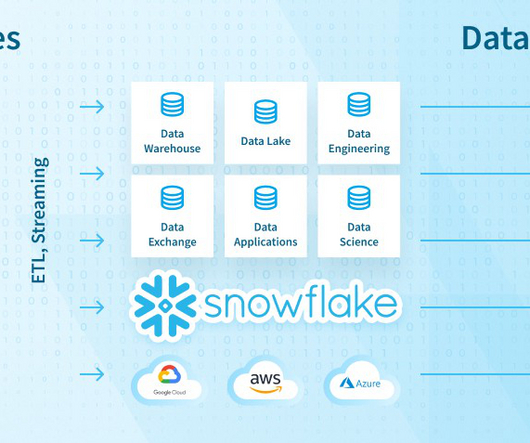
Built for integration, scalability, governance, and industry-leading security, Snowflake optimizes how you can leverage your organization’s data, providing the following benefits: Built to Be a Source of Truth Snowflake is built to simplify data integration wherever it lives and whatever form it takes.
Employing a modular structure, SAP ERP encompasses modules such as finance, human resources, supply chain , and more, facilitating real-time collaboration and data sharing across different departments through a centralized database. SAP is relatively easy to work with.
Thus, the solution allows for scaling data workloads independently from one another and seamlessly handling data warehousing, data lakes , data sharing, and engineering. Snowflake Database Pros Extensive Storage Opportunities Snowflake provides affordability, scalability, and a user-friendly interface.
Hierarchies align datamodelling with business processes, making it easier to analyse data in a context that reflects real-world operations. Designing Hierarchies Designing effective hierarchies requires careful consideration of the business requirements and the datamodel.
Because they are the most likely to communicate data insights, they’ll also need to know SQL, and visualization tools such as Power BI and Tableau as well. Some of the tools and techniques unique to business analysts are pivot tables, financial modeling in Excel, Power BI Dashboards for forecasting, and Tableau for similar purposes.
These tools enable effective data structuring, transformation, and analysis, supporting best practices for dimensional modelling and ensuring high-quality, consistent business metrics. These tools are essential for populating fact tables with accurate and timely data.
It’s easy for our minds to immediately think of BI tools, especially with the recent flurry of M&A activity: Salesforce’s acquisition of Tableau and Google’s acquisition of Looker. A key finding of the survey is that the ability to find data contributes greatly to the success of BI initiatives.
Knowledge of Core Data Engineering Concepts Ensure one possess a strong foundation in core data engineering concepts, which include data structures, algorithms, database management systems, datamodeling , data warehousing , ETL (Extract, Transform, Load) processes, and distributed computing frameworks (e.g.,
Business Intelligence Analyst Focuses on transforming raw data into actionable business insights to support strategic decision-making. 9,43,649 Business acumen, Data Visualisation tools (e.g., Tableau), communication skills Combine business studies with data courses, engage in case studies, and attend industry conferences.
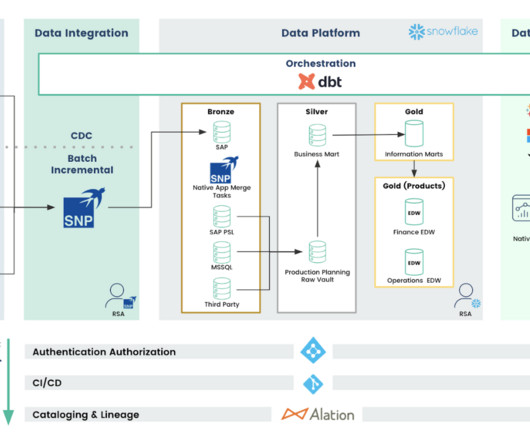
Sidebar Navigation: Provides a catalog sidebar for browsing resources by type, package, file tree, or database schema, reflecting the structure of both dbt projects and the data platform. Version Tracking: Displays version information for models, indicating whether they are prerelease, latest, or outdated.
Without data engineering , companies would struggle to analyse information and make informed decisions. What Does a Data Engineer Do? A data engineer creates and manages the pipelines that transfer data from different sources to databases or cloud storage. How is Data Engineering Different from Data Science?
We organize all of the trending information in your field so you don't have to. Join 17,000+ users and stay up to date on the latest articles your peers are reading.
You know about us, now we want to get to know you!
Let's personalize your content
Let's get even more personalized
We recognize your account from another site in our network, please click 'Send Email' below to continue with verifying your account and setting a password.


Let's personalize your content