This site uses cookies to improve your experience. To help us insure we adhere to various privacy regulations, please select your country/region of residence. If you do not select a country, we will assume you are from the United States. Select your Cookie Settings or view our Privacy Policy and Terms of Use.
Cookie Settings
Cookies and similar technologies are used on this website for proper function of the website, for tracking performance analytics and for marketing purposes. We and some of our third-party providers may use cookie data for various purposes. Please review the cookie settings below and choose your preference.
Used for the proper function of the website
Used for monitoring website traffic and interactions
Cookie Settings
Cookies and similar technologies are used on this website for proper function of the website, for tracking performance analytics and for marketing purposes. We and some of our third-party providers may use cookie data for various purposes. Please review the cookie settings below and choose your preference.
Strictly Necessary: Used for the proper function of the website
Performance/Analytics: Used for monitoring website traffic and interactions
This article was published as a part of the Data Science Blogathon. Introduction A datamodel is an abstraction of real-world events that we use to create, capture, and store data in a database that user applications require, omitting unnecessary details.
New big data architectures and, above all, data sharing concepts such as Data Mesh are ideal for creating a common database for many data products and applications. The Event Log DataModel for Process Mining Process Mining as an analytical system can very well be imagined as an iceberg.
While the front-end report visuals are important and the most visible to end users, a lot goes on behind the scenes that contribute heavily to the end product, including datamodeling. In this blog, we’ll describe datamodeling and its significance in Power BI. What is DataModeling?
Data Mesh on Azure Cloud with Databricks and Delta Lake for Applications of Business Intelligence, Data Science and Process Mining. With the concept of Data Mesh you will be able to access all your organizational internal and external data sources once and provides the data as several datamodels for all your analytical applications.
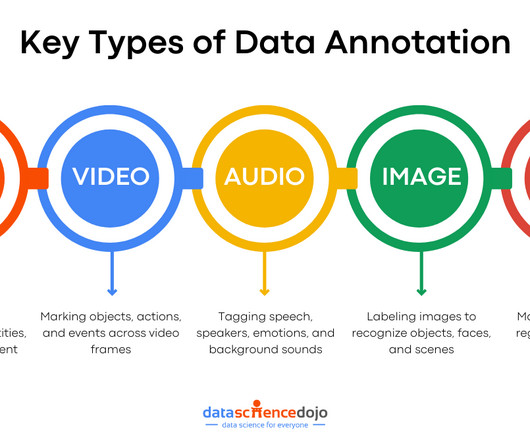
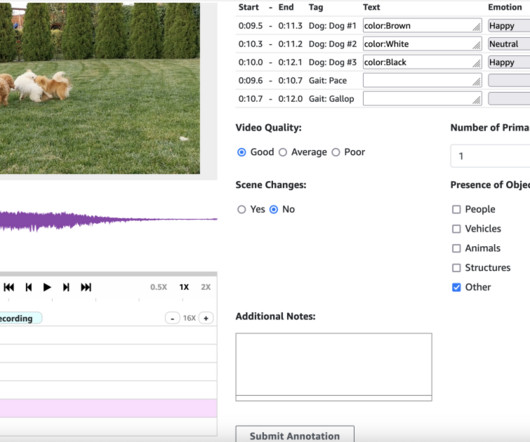
Video Annotation It is similar to image annotation but is applied to video data. Video annotation identifies and marks objects, actions, and events across video frames. This enables models to recognize and interpret dynamic visual information. Annotation teaches the model to recognize the correct meaning based on context.
They deliver a single access point for all data regardless of location — whether it’s at rest or in motion. Experts agree that data fabrics are the future of data analytics and […]. The post Maximizing Your Data Fabric’s ROI via Entity DataModeling appeared first on DATAVERSITY.
Introduction Depending on the sector and the particular example, anomaly detection entails spotting out-of-the-ordinary or erratic patterns in data to spot undesirable or odd events.
Women in Big Data and LinkedIn hosted an empowering event The Responsible AI at Scale in LinkedIn HQ in Sunnyvale, CA on March 13 th , 2025, for people passionate about ethics, transparency and shaping the AI technologies of the future. I cant wait for the next Women in Big Dataevent!
Select options and train the model The next step towards building and training a fraud detector model is to define the business activity (event) to evaluate for the fraud. Defining an event involves setting the variables in your dataset, an entity initiating the event, and the labels that classify the event.
Key Skills Proficiency in SQL is essential, along with experience in data visualization tools such as Tableau or Power BI. Strong analytical skills and the ability to work with large datasets are critical, as is familiarity with datamodeling and ETL processes.
Key features of cloud analytics solutions include: Datamodels , Processing applications, and Analytics models. Datamodels help visualize and organize data, processing applications handle large datasets efficiently, and analytics models aid in understanding complex data sets, laying the foundation for business intelligence.
Working with AWS, Light & Wonder recently developed an industry-first secure solution, Light & Wonder Connect (LnW Connect), to stream telemetry and machine health data from roughly half a million electronic gaming machines distributed across its casino customer base globally when LnW Connect reaches its full potential.
I’ve found that while calculating automation benefits like time savings is relatively straightforward, users struggle to estimate the value of insights, especially when dealing with previously unavailable data. We were developing a datamodel to provide deeper insights into logistics contracts.
In marketing, artificial intelligence (AI) is the process of using datamodels, mathematics, and algorithms to generate insights that marketers can use. Marketers use insights gained from AI to guide future decisions on event spending, strategy, and content topics. What Is Artificial Intelligence Marketing? AI also […].
Interpolation: Use interpolation methods to estimate missing values in time series data. Model-based imputation: Train a model to predict missing values based on other features in the dataset. Networking Platforms: Meetup: Attend AI-related meetups and networking events to connect with professionals in the field.
Since the field covers such a vast array of services, data scientists can find a ton of great opportunities in their field. Data scientists use algorithms for creating datamodels. These datamodels predict outcomes of new data. Data science is one of the highest-paid jobs of the 21st century.
Regardless of your industry, whether it’s an enterprise insurance company, pharmaceuticals organization, or financial services provider, it could benefit you to gather your own data to predict future events. From a predictive analytics standpoint, you can be surer of its utility. Deep Learning, Machine Learning, and Automation.
var ( // Arrow schema for the OTLP Arrow Traces record (without attributes, links, and events). An overview of the different components and events used to implement this approach is depicted in figure 1. If a field exists in the data but is not included in the schema, the encoder will trigger a missing field event.
client( service_name='bedrock-runtime', region_name='us-east-1' ) Define the prompt as follows: prompt = "write an article about fictional planet Foobar" Edit the API request and put it in keyword argument as before: We use the API request of the claude-v2 model.
Here is the prompt that we utilized for our task (incorrect markdown rendering on the Medium side): You are an intelligent assistant designed to analyze product reviews and extract specific information to populate a structured datamodel. Your task is to process a given product review text and extract the following fields:1.
Over the years, our annual conference has grown from a 300-person event into a 2,500-person event, doubling growth every year. Our 2023 event is taking place at the MGM Grand in Las Vegas August 7–9. Join thousands of data leaders on the AI newsletter. You can learn more and sign up here.
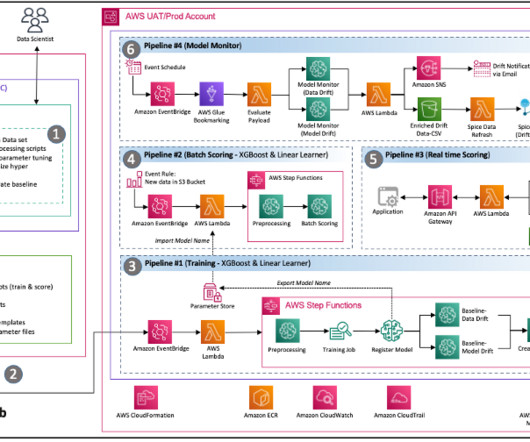
MLOps – The architecture implements a SageMaker model monitoring pipeline for continuous model quality governance by validating data and model drift as required by the defined schedule. Whenever drift is detected, an event is launched to notify the respective teams to take action or initiate model retraining.
Graph databases and knowledge graphs are among the most widely adopted solutions for managing data represented as graphs, consisting of nodes (entities) and edges (relationships). Knowledge graphs extend the capabilities of graph databases by incorporating mechanisms to infer and derive new knowledge from the existing graph data.
The thing is, previously data analytics was based on models that perpetually extended into the future; unfortunately, most of these models have become obsolete in today’s circumstances. Before the pandemic, enterprise managers lived in the illusion that all future events could be predicted.
“I liked working with numbers but I knew that accounting was not really for me, so I signed up for a course in data science which ultimately inspired me to get my Master’s degree in DataModeling.” “A They create relevant posts on social media and inform their followers about upcoming events.”Asking
It is more challenging than ever for IT operations (ITOps) teams to maintain a complete view of their end-to-end IT environment and effectively manage events and incidents. Incident consolidation: By consolidating data from various sources, AIOps Insights reduces noise and provides a comprehensive view of incidents for faster resolution.
We chose Power BI to make our final product due to its capacity for presenting robust numerical visualizations together with text fields, allowing us to tell a powerful story with the data. Within Power BI, we made a simple relational datamodel from the datasets by linking them together along common coordinates.
Complex mathematical algorithms are used to segment data and estimate the likelihood of subsequent events. Every Data Scientist needs to know Data Mining as well, but about this moment we will talk a bit later. Where to Use Data Science? Data Mining Techniques and Data Visualization.
By acquiring expertise in statistical techniques, machine learning professionals can develop more advanced and sophisticated algorithms, which can lead to better outcomes in data analysis and prediction. These techniques can be utilized to estimate the likelihood of future events and inform the decision-making process.
I was privileged to deliver a workshop at Enterprise Data World 2024. Publishing this review is a way to express my gratitude to the fantastic team at DATAVERSITY and Tony Shaw personally for organizing this prestigious live event.
Apache Hive was used to provide a tabular interface to data stored in HDFS, and to integrate with Apache Spark SQL. Apache HBase was employed to offer real-time key-based access to data. Data is stored in HDFS and is accessed via Hive, which provides a tabular interface to the data and integrates with Spark SQL.
And the dates span from 1887 to 1985, so players who weren’t alive at the same time can be linked through older or younger intermediaries, which we’ll see by inspecting data timelines using KronoGraph. Which data elements should be nodes and what should connect them? I chose ‘event’ as my partition key. New to Azure Cosmos DB?
You can combine this data with real datasets to improve AI model training and predictive accuracy. Creating synthetic test data to expedite testing, optimization and validation of new applications and features. Using synthetic data to prevent the exposure of sensitive data in machine learning algorithms.
Analysts rely on our data visualization toolkits to spot hidden patterns in their visualized data. They investigate these patterns and use them to predict – and, if possible, prevent – future events. What role can interactive data visualization play? I chose one containing significant earthquakes (5.5+
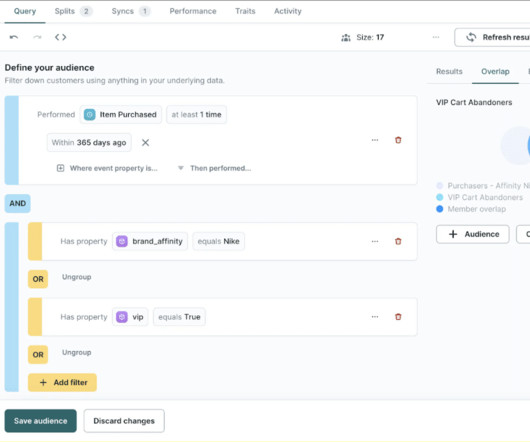
Event Tracking : Capturing behavioral events such as page views, add-to-cart, signup, purchase, subscription, etc. Identity Resolution : Merging behavioral events and customer identifiers in an identity graph to create a single comprehensive customer profile. dbt has become the standard for modeling.
OSINT is about understanding the connections between individuals, entities, and events hidden within vast datasets. The graph datamodel is a natural fit, helping investigators make sense of even the most complex datasets. Thats where visual link analysis comes in.
In contrast, data warehouses and relational databases adhere to the ‘Schema-on-Write’ model, where data must be structured and conform to predefined schemas before being loaded into the database. You can also get data science training on-demand wherever you are with our Ai+ Training platform.
ETL Design Pattern The ETL (Extract, Transform, Load) design pattern is a commonly used pattern in data engineering. It is used to extract data from various sources, transform the data to fit a specific datamodel or schema, and then load the transformed data into a target system such as a data warehouse or a database.
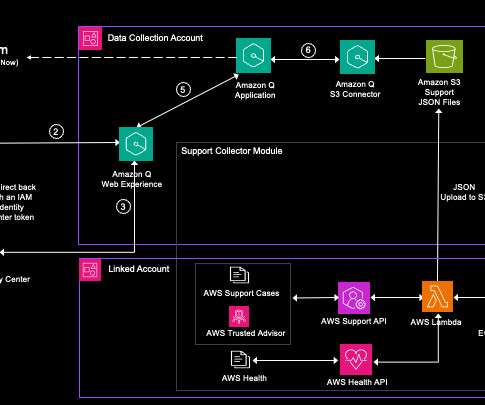
Ingesting data for support cases, Trusted Advisor checks, and AWS Health notifications into Amazon Q Business enables interactions through natural language conversations, sentiment analysis, and root cause analysis without needing to fully understand the underlying datamodels or schemas. How can I speed it up?
When you design your datamodel, you’ll probably begin by sketching out your data in a graph format – representing entities as nodes and relationships as links. Working in a graph database means you can take that whiteboard model and apply it directly to your schema with relatively few adaptations.
Data Quality: The accuracy and completeness of data can impact the quality of model predictions, making it crucial to ensure that the monitoring system is processing clean, accurate data. Model Complexity: As machine learning models become more complex, monitoring them in real-time becomes more challenging.
These services are designed for scalability, event-driven architectures, and efficient resource utilization. client("s3") o = urlparse(s3_file, allow_fragments=False) bucket = o.netloc key = o.path.lstrip("/") s3.download_file(bucket, and requirements.txt files and save it as model.tar.gz : !
Remember: The right combination of keyboard efficiency and design aesthetics elevates the impact of your data visualization techniques. DataModeling and Drill-Through Techniques Datamodeling plays a crucial role in data visualization. One of the most powerful techniques in datamodeling is drill-through.
We organize all of the trending information in your field so you don't have to. Join 17,000+ users and stay up to date on the latest articles your peers are reading.
You know about us, now we want to get to know you!
Let's personalize your content
Let's get even more personalized
We recognize your account from another site in our network, please click 'Send Email' below to continue with verifying your account and setting a password.


Let's personalize your content