This site uses cookies to improve your experience. To help us insure we adhere to various privacy regulations, please select your country/region of residence. If you do not select a country, we will assume you are from the United States. Select your Cookie Settings or view our Privacy Policy and Terms of Use.
Cookie Settings
Cookies and similar technologies are used on this website for proper function of the website, for tracking performance analytics and for marketing purposes. We and some of our third-party providers may use cookie data for various purposes. Please review the cookie settings below and choose your preference.
Used for the proper function of the website
Used for monitoring website traffic and interactions
Cookie Settings
Cookies and similar technologies are used on this website for proper function of the website, for tracking performance analytics and for marketing purposes. We and some of our third-party providers may use cookie data for various purposes. Please review the cookie settings below and choose your preference.
Strictly Necessary: Used for the proper function of the website
Performance/Analytics: Used for monitoring website traffic and interactions
Data is an essential component of any business, and it is the role of a data analyst to make sense of it all. PowerBI is a powerfuldata visualization tool that helps them turn raw data into meaningful insights and actionable decisions.
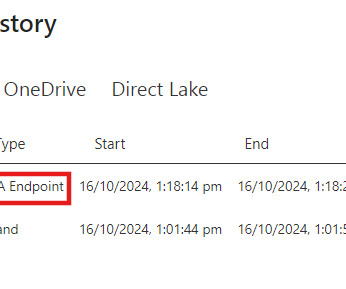
We all know how easy it is to refresh a single table in PowerBI Desktop by right-clicking the table and selecting Refresh Data. However, in PowerBI Service, we can only refresh the entire semantic model, as there is no out-of-the-box solution for refreshing a single table.
It offers full BI-Stack Automation, from source to data warehouse through to frontend. It supports a holistic datamodel, allowing for rapid prototyping of various models. It also supports a wide range of data warehouses, analytical databases, data lakes, frontends, and pipelines/ETL.
Their role is crucial in understanding the underlying data structures and how to leverage them for insights. Key Skills Proficiency in SQL is essential, along with experience in data visualization tools such as Tableau or PowerBI. Familiarity with machine learning, algorithms, and statistical modeling.
How to Optimize PowerBI and Snowflake for Advanced Analytics Spencer Baucke May 25, 2023 The world of business intelligence and data modernization has never been more competitive than it is today. Table of Contents Why Discuss Snowflake & PowerBI?
PowerBI Desktop enables the connection and retrieval of data from various sources, followed by data transformation using Power Query. To address this challenge, Microsoft introduced Dataflows within the PowerBI service. What are Dataflows in PowerBI?
New big data architectures and, above all, data sharing concepts such as Data Mesh are ideal for creating a common database for many data products and applications. The Event Log DataModel for Process Mining Process Mining as an analytical system can very well be imagined as an iceberg.
The Datamarts capability opens endless possibilities for organizations to achieve their data analytics goals on the PowerBI platform. Before we look into the PowerBI Datamarts, let us take a step back and understand the meaning of a Datamart. What is PowerBI Datamarts? What is a Datamart?
Summary: PowerBI is a business analytics tool transforming data into actionable insights. Key features include AI-powered analytics, extensive data connectivity, customisation options, and robust datamodelling. Supports diverse data sources: Excel, SQL Server, Azure, and more.
This capability, rooted in the sophisticated world of Natural Language Processing (NLP), removes the barriers that often complicate data retrieval and analysis, making insights accessible to everyone, regardless of their technical expertise. What is Natural Language Query (NLQ)?
Summary: PowerBI is a leading data analytics platform offering advanced features like real-time analytics and collaborative capabilities. Understanding its significance is vital for aspiring PowerBI developers. Mastering PowerBI can significantly enhance career prospects, given its prevalence in the industry.
Summary: PowerBI alternatives like Tableau, Qlik Sense, and Zoho Analytics provide businesses with tailored Data Analysis and Visualisation solutions. Selecting the right alternative ensures efficient data-driven decision-making and aligns with your organisation’s goals and budget. What is PowerBI?
Though both are great to learn, what gets left out of the conversation is a simple yet powerful programming language that everyone in the data science world can agree on, SQL. But why is SQL, or Structured Query Language , so important to learn? Finally, SQL’s window function. Let’s briefly dive into each bit.
PowerBI Heatmap: Heatmap in PowerBI refers to the type of custom visualisation that businesses analysts utilise for showcasing the relationship between two variables on a map in different colour patches. It offers a wide range of features that make it a popular choice for data professionals, analysts, and organizations.
PowerBI Datamarts is one of the most exciting features that Microsoft has released for the Power Platform in recent years. If you need high-level information on what a PowerBI Datamart is and some example use cases, check out our other blog, What Are PowerBI Datamarts?
PowerBI is a versatile and scalable platform that combines self-service and enterprise business intelligence (BI) capabilities. It serves as a comprehensive solution for connecting to diverse data sources and creating compelling visualizations. What is the SWITCH Function?
Data Analysis is one of the most crucial tasks for business organisations today. SQL or Structured Query Language has a significant role to play in conducting practical Data Analysis. That’s where SQL comes in, enabling data analysts to extract, manipulate and analyse data from multiple sources.
There is a plethora of BI tools available in the market today, with new ones being added yearly. Through a comparative analysis of some of the leading BI tools: Google Looker, Microsoft PowerBI, Tableau and Qlik Sense, discover which BI solution best fits your organization’s data analytics needs to empower informed decision-making.
Summary: Data engineering tools streamline data collection, storage, and processing. Tools like Python, SQL, Apache Spark, and Snowflake help engineers automate workflows and improve efficiency. Learning these tools is crucial for building scalable data pipelines.
Before we dive right in, you’d totally love to check out the deliverables that came with this project (a PowerPoint presentation and a very insightful PowerBI dashboard). And I hope that after you’ve gone through my presentation here , you’ll want to invest in Data Bank. See the links below! Now, let’s get started. ?
Summary: Business Intelligence Analysts transform raw data into actionable insights. They use tools and techniques to analyse data, create reports, and support strategic decisions. Key skills include SQL, data visualization, and business acumen. Introduction We are living in an era defined by data.
It is the process of converting raw data into relevant and practical knowledge to help evaluate the performance of businesses, discover trends, and make well-informed choices. Data gathering, data integration, datamodelling, analysis of information, and data visualization are all part of intelligence for businesses.
Key Takeaways Operations Analysts optimise efficiency through data-driven decision-making. Expertise in tools like PowerBI, SQL, and Python is crucial. Expertise in programs like Microsoft Excel, SQL , and business intelligence (BI) tools like PowerBI or Tableau allows analysts to process and visualise data efficiently.
To pursue a data science career, you need a deep understanding and expansive knowledge of machine learning and AI. And you should have experience working with big data platforms such as Hadoop or Apache Spark. Data scientists will typically perform data analytics when collecting, cleaning and evaluating data.
Data engineers are essential professionals responsible for designing, constructing, and maintaining an organization’s data infrastructure. They create data pipelines, ETL processes, and databases to facilitate smooth data flow and storage. Data Visualization: Matplotlib, Seaborn, Tableau, etc.
Though scripted languages such as R and Python are at the top of the list of required skills for a data analyst, Excel is still one of the most important tools to be used. Because they are the most likely to communicate data insights, they’ll also need to know SQL, and visualization tools such as PowerBI and Tableau as well.
Some of the common career opportunities in BI include: Entry-level roles Data analyst: A data analyst is responsible for collecting and analyzing data, creating reports, and presenting insights to stakeholders. They may also be involved in datamodeling and database design.
Some of the common career opportunities in BI include: Entry-level roles Data analyst: A data analyst is responsible for collecting and analyzing data, creating reports, and presenting insights to stakeholders. They may also be involved in datamodeling and database design.
Hierarchies align datamodelling with business processes, making it easier to analyse data in a context that reflects real-world operations. Designing Hierarchies Designing effective hierarchies requires careful consideration of the business requirements and the datamodel.
Tableau is an interactive platform that enables users to analyse and visualise data to gain insights. Consequently, if your results, scores, etc are stored in an SQL Database, Tableau can be able to quickly visualise easily your model metrics. With SQL queries Tableau helps in integrating with them effectively.
They are useful for big data analytics where flexibility is needed. DataModelingDatamodeling involves creating logical structures that define how data elements relate to each other. This includes: Dimensional Modeling : Organizes data into dimensions (e.g., time, product) and facts (e.g.,
Knowledge of Core Data Engineering Concepts Ensure one possess a strong foundation in core data engineering concepts, which include data structures, algorithms, database management systems, datamodeling , data warehousing , ETL (Extract, Transform, Load) processes, and distributed computing frameworks (e.g.,
These tools enable effective data structuring, transformation, and analysis, supporting best practices for dimensional modelling and ensuring high-quality, consistent business metrics. These tools are essential for populating fact tables with accurate and timely data.
Comparison with Traditional Relational Databases Traditional relational databases (RDBMS) like MySQL or PostgreSQL store data in structured tables with predefined schemas. In contrast, MongoDB’s document-based model allows for a more flexible and scalable approach. MongoDB is a NoSQL database that uses a document-oriented datamodel.
We organize all of the trending information in your field so you don't have to. Join 17,000+ users and stay up to date on the latest articles your peers are reading.
You know about us, now we want to get to know you!
Let's personalize your content
Let's get even more personalized
We recognize your account from another site in our network, please click 'Send Email' below to continue with verifying your account and setting a password.


Let's personalize your content