This site uses cookies to improve your experience. To help us insure we adhere to various privacy regulations, please select your country/region of residence. If you do not select a country, we will assume you are from the United States. Select your Cookie Settings or view our Privacy Policy and Terms of Use.
Cookie Settings
Cookies and similar technologies are used on this website for proper function of the website, for tracking performance analytics and for marketing purposes. We and some of our third-party providers may use cookie data for various purposes. Please review the cookie settings below and choose your preference.
Used for the proper function of the website
Used for monitoring website traffic and interactions
Cookie Settings
Cookies and similar technologies are used on this website for proper function of the website, for tracking performance analytics and for marketing purposes. We and some of our third-party providers may use cookie data for various purposes. Please review the cookie settings below and choose your preference.
Strictly Necessary: Used for the proper function of the website
Performance/Analytics: Used for monitoring website traffic and interactions
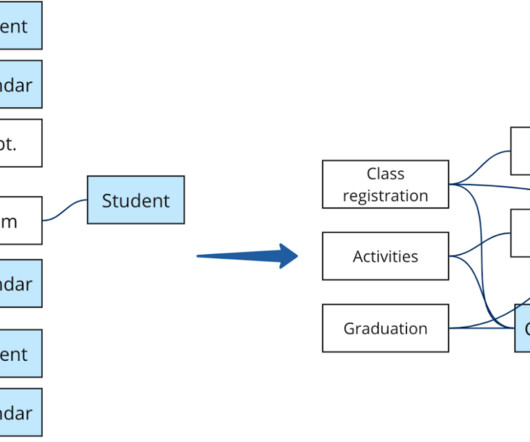
Introduction This article will introduce the concept of datamodeling, a crucial process that outlines how data is stored, organized, and accessed within a database or data system. It involves converting real-world business needs into a logical and structured format that can be realized in a database or data warehouse.
Summary: Big Datavisualization involves representing large datasets graphically to reveal patterns, trends, and insights that are not easily discernible from raw data. quintillion bytes of data daily, the need for effective visualization techniques has never been greater. As we generate approximately 2.5
Top 10 Professions in Data Science: Below, we provide a list of the top data science careers along with their corresponding salary ranges: 1. Data Scientist Data scientists are responsible for designing and implementing datamodels, analyzing and interpreting data, and communicating insights to stakeholders.
The primary aim is to make sense of the vast amounts of data generated daily by combining statistical analysis, programming, and datavisualization. It is divided into three primary areas: data preparation, datamodeling, and datavisualization.
A Data Product can take various forms, depending on the domain’s requirements and the data it manages. It could be a curated dataset, a machine learning model, an API that exposes data, a real-time data stream, a datavisualization dashboard, or any other data-related asset that provides value to the organization.
Skills for data analysts 2023 10 essential skills for data analysts to have in 2023 Here are 10 essential skills for data analysts to have in 2023: 1. DataVisualization: Topping the list of skills for data analysts datavisualization stands first.
These skills include programming languages such as Python and R, statistics and probability, machine learning, datavisualization, and datamodeling. Data preparation is an essential step in the data science workflow, and data scientists should be familiar with various data preparation tools and best practices.
Data is an essential component of any business, and it is the role of a data analyst to make sense of it all. Power BI is a powerful datavisualization tool that helps them turn raw data into meaningful insights and actionable decisions. Check out this course and learn Power BI today!
According to Forbes, Almost eighty-thousand scientific studies attest that visual images promote retention. Research has shown that many people learn best when they see a story or information depicted in an image.
Their role is crucial in understanding the underlying data structures and how to leverage them for insights. Key Skills Proficiency in SQL is essential, along with experience in datavisualization tools such as Tableau or Power BI.
Data Analyst Data Analyst is a featured GPT in the store that specializes in data analysis and visualization. You can upload your data files to this GPT that it can then analyze. Other than the advanced data analysis, it can also deal with image conversions. It is capable of writing and running Python codes.
We have talked in the past about the importance of datavisualization in business. However, many companies are struggling to figure out how to use datavisualization effectively. One of the ways to accomplish this is with presentation templates that can use datamodeling. Keep reading to learn more.
Data engineering tools offer a range of features and functionalities, including data integration, data transformation, data quality management, workflow orchestration, and datavisualization. Essential data engineering tools for 2023 Top 10 data engineering tools to watch out for in 2023 1.
In the digital era, datavisualization stands as an indispensable tool in the realm of business intelligence. It represents the graphical display of data and information, transforming complex datasets into intuitive and understandable visuals.
In this tutorial for JavaScript developers, I’ll demonstrate how to integrate our graph visualization SDKs with Neo4j to create a powerful datavisualization web app. FREE: Start your KeyLines trial today Visualize your data! Right – let’s start building our datavisualization web app!
Countless hours vizzing, a standout Tableau Public profile , and a graduate degree later, Karolina reflects on her data journey and what led her to her current role as a Business Intelligence Analyst at Schneider Electric. I already had some interest in datavisualization, I just didn't know where to start.
The purpose of datavisualization is to facilitate the perception of information arrays and to identify patterns that are difficult to notice in a text table. To make a useful and powerful infographic, you need to follow the laws and regulations of datavisualization.
Key features of cloud analytics solutions include: Datamodels , Processing applications, and Analytics models. Datamodels help visualize and organize data, processing applications handle large datasets efficiently, and analytics models aid in understanding complex data sets, laying the foundation for business intelligence.
Data Analyst Data Analyst is a featured GPT in the store that specializes in data analysis and visualization. You can upload your data files to this GPT that it can then analyze. Other than the advanced data analysis, it can also deal with image conversions. It is capable of writing and running Python codes.
Data Analyst Data Analyst is a featured GPT in the store that specializes in data analysis and visualization. You can upload your data files to this GPT that it can then analyze. Other than the advanced data analysis, it can also deal with image conversions. It is capable of writing and running Python codes.
In conclusion, the extent of programming knowledge depends on where you want to work across the broad spectrum of the data science field. 5. Learning a tool is enough to become a data scientist Knowing a particular programming language, or a datavisualization tool is not all you need to become a data scientist.
If you occasionally run business stands in fairs, congresses and exhibitions, business stands designers can incorporate business intelligence to aid in better business and client data collection. Business intelligence tools can include data warehousing, datavisualizations, dashboards, and reporting.
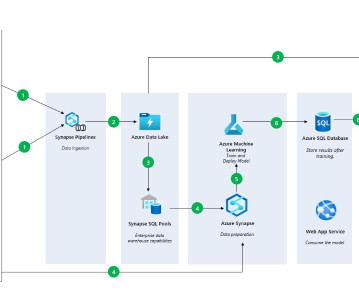
Using Azure ML to Train a Serengeti DataModel, Fast Option Pricing with DL, and How To Connect a GPU to a Container Using Azure ML to Train a Serengeti DataModel for Animal Identification In this article, we will cover how you can train a model using Notebooks in Azure Machine Learning Studio.
This article was co-written by Manish Garg & Hakeem Lawrence A common challenge with many business intelligence tools is building trust, often when there isn’t a datamodel and when various BI tools throughout the organization provide conflicting results. What Can You Do With Omni?
This feature helps automate many parts of the data preparation and datamodel development process. This significantly reduces the amount of time needed to engage in data science tasks. A text analytics interface that helps derive actionable insights from unstructured data sets.
Therefore, machine learning is of great importance for almost any field, but above all, it will work well where there is Data Science. Data Mining Techniques and DataVisualization. Data Mining is an important research process.
It is the process of converting raw data into relevant and practical knowledge to help evaluate the performance of businesses, discover trends, and make well-informed choices. Data gathering, data integration, datamodelling, analysis of information, and datavisualization are all part of intelligence for businesses.
Summary: Business Intelligence Analysts transform raw data into actionable insights. They use tools and techniques to analyse data, create reports, and support strategic decisions. Key skills include SQL, datavisualization, and business acumen. Introduction We are living in an era defined by data.
Power BI proves to be the best tool for analysis and visualization of data. Microsoft Power BI is a Business Intelligence and DataVisualization tool which assists organizations to analyze data from multiple sources, convert it into an interactive dashboard and share insights.
It integrates seamlessly with a wide range of data sources like Excel, Azure and SQL server, Salesforce, SAP Hana, IBM Netezza and CDP which makes it a compelling choice for businesses that have already invested in the Microsoft ecosystem. It allows users to create highly customizable and visually appealing reports.
Since the field covers such a vast array of services, data scientists can find a ton of great opportunities in their field. Data scientists use algorithms for creating datamodels. These datamodels predict outcomes of new data. Data science is one of the highest-paid jobs of the 21st century.
Its your feedback and collaboration that help us push the boundaries of whats possible in datavisualization and analytics. This feature helps provide a consistent experience across all viewers' browsers, while maintaining the intended look and feel of your datavisualizations and dashboards.
js and Tableau Data science, data analytics and IBM Practicing data science isn’t without its challenges. There can be fragmented data, a short supply of data science skills and rigid IT standards for training and deployment.
What do machine learning engineers do: They implement and train machine learning modelsDatamodeling One of the primary tasks in machine learning is to analyze unstructured datamodels, which requires a solid foundation in datamodeling. R is especially popular in academia and research.
Two of the platforms that we see emerging as a popular combination of data warehousing and business intelligence are the Snowflake Data Cloud and Power BI. Debuting in 2015, Power BI has undergone meaningful updates that have made it a leader not just in datavisualization, but in the business intelligence space as well.
Cut costs by consolidating data warehouse investments. Think of Tableau as your datavisualization and business intelligence layer on top of Genie—allowing you to see, understand, and act on your live customer data. Harmonize your customer data into a unified view by mapping data sources into shared datamodels in Genie.
Cut costs by consolidating data warehouse investments. Think of Tableau as your datavisualization and business intelligence layer on top of Genie—allowing you to see, understand, and act on your live customer data. Harmonize your customer data into a unified view by mapping data sources into shared datamodels in Genie.
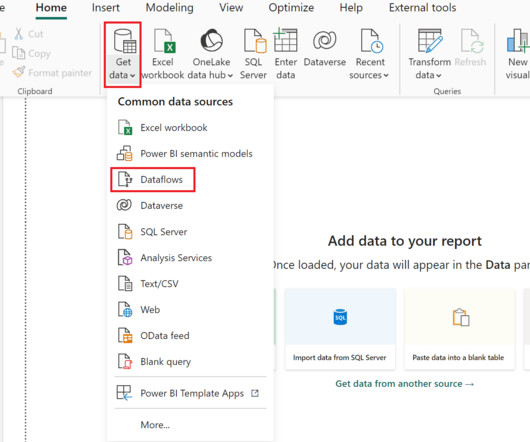
The typical flow of data from the data source to the Power BI dashboard is the following: Tables with data that are queried from the source The data is transformed in Power Query Data is then loaded into Power BI The datamodel is created with all of the necessary relationships between the tables.
Leveraging Looker’s semantic layer will provide Tableau customers with trusted, governed data at every stage of their analytics journey. With its LookML modeling language, Looker provides a unique, modern approach to define governed and reusable datamodels to build a trusted foundation for analytics.
Summary: This blog dives into the most promising Power BI projects, exploring advanced datavisualization, AI integration, IoT & blockchain analytics, and emerging technologies. Discover best practices for successful implementation and propel your organization towards data-driven success.
Business Intelligence tools encompass a variety of software applications designed to collect, process, analyse, and present business data. These tools enable organizations to convert raw data into actionable insights through various means such as reporting, analytics, datavisualization, and performance management.
April 2018), which focused on users who do understand joins and curating federated data sources. May 2020) shifted sheets to a multiple-table datamodel, where the sheet’s fields allow the computer to write much more efficient queries to the data sources. Relationships in Tableau 2020.2 (May Beginning in Tableau 2020.2,
The primary reason data lakes were so attractive to companies was the promise of agile processing of data in order to provide real-time (or near real-time) results on data sets. In order for this to even be possible, the datavisualization aspect needs to be streamlined to show exactly what the user wants to see.
DataModeling : Using libraries like scikit-learn and Tensorflow, one can build and evaluate predictive models. Data Communication : Communicate insights and results to stakeholders through reports, dashboards, and visualizations using libraries such as Matplotlib, Seaborn, and Plotly. Python helps in this process.
We organize all of the trending information in your field so you don't have to. Join 17,000+ users and stay up to date on the latest articles your peers are reading.
You know about us, now we want to get to know you!
Let's personalize your content
Let's get even more personalized
We recognize your account from another site in our network, please click 'Send Email' below to continue with verifying your account and setting a password.


Let's personalize your content