This site uses cookies to improve your experience. To help us insure we adhere to various privacy regulations, please select your country/region of residence. If you do not select a country, we will assume you are from the United States. Select your Cookie Settings or view our Privacy Policy and Terms of Use.
Cookie Settings
Cookies and similar technologies are used on this website for proper function of the website, for tracking performance analytics and for marketing purposes. We and some of our third-party providers may use cookie data for various purposes. Please review the cookie settings below and choose your preference.
Used for the proper function of the website
Used for monitoring website traffic and interactions
Cookie Settings
Cookies and similar technologies are used on this website for proper function of the website, for tracking performance analytics and for marketing purposes. We and some of our third-party providers may use cookie data for various purposes. Please review the cookie settings below and choose your preference.
Strictly Necessary: Used for the proper function of the website
Performance/Analytics: Used for monitoring website traffic and interactions
New big data architectures and, above all, data sharing concepts such as Data Mesh are ideal for creating a common database for many data products and applications. The Event Log DataModel for Process Mining Process Mining as an analytical system can very well be imagined as an iceberg.
Ateken Abla March 19, 2024 - 9:05pm Larissa Amoroso Vice President, Tableau Community, Tableau When Karolina Grodzinska took the stage at Tableau Conference as part of her Iron Viz: Student Edition award, it felt like the culmination of her data learning, which started in 2021. How did Karolina discover Tableau? “It
Their role is crucial in understanding the underlying data structures and how to leverage them for insights. Key Skills Proficiency in SQL is essential, along with experience in data visualization tools such as Tableau or Power BI.
While the front-end report visuals are important and the most visible to end users, a lot goes on behind the scenes that contribute heavily to the end product, including datamodeling. In this blog, we’ll describe datamodeling and its significance in Power BI. What is DataModeling?
Even within Tableau, an organization focused on analytics, we have our fair share of governance problems—and they’re not unlike what our customers can experience every day. . With a holistic approach to data governance, you can get to the root of common problems, rather than chasing one-off issues. Datamodeling.
Even within Tableau, an organization focused on analytics, we have our fair share of governance problems—and they’re not unlike what our customers can experience every day. . With a holistic approach to data governance, you can get to the root of common problems, rather than chasing one-off issues. Datamodeling.
Some of the common career opportunities in BI include: Entry-level roles Data analyst: A data analyst is responsible for collecting and analyzing data, creating reports, and presenting insights to stakeholders. They may also be involved in datamodeling and database design.
Some of the common career opportunities in BI include: Entry-level roles Data analyst: A data analyst is responsible for collecting and analyzing data, creating reports, and presenting insights to stakeholders. They may also be involved in datamodeling and database design.
Diagnostic analytics: Diagnostic analytics helps pinpoint the reason an event occurred. js and TableauData science, data analytics and IBM Practicing data science isn’t without its challenges. Manufacturers can analyze a failed component on an assembly line and determine the reason behind its failure.
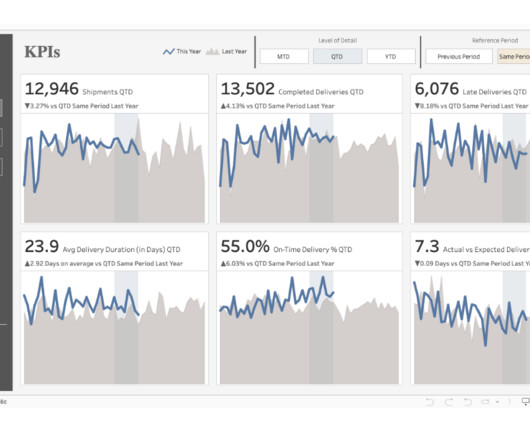
Check out this dashboard example built in Tableau that provides users with the ability to track key shipment and delivery metrics over time: Client Example A startup food manufacturer was utilizing social media data to track trends and find niche markets to develop new products.
Because they are the most likely to communicate data insights, they’ll also need to know SQL, and visualization tools such as Power BI and Tableau as well. Some of the tools and techniques unique to business analysts are pivot tables, financial modeling in Excel, Power BI Dashboards for forecasting, and Tableau for similar purposes.
These tables are called “factless fact tables” or “junction tables” They are used for modelling many-to-many relationships or for capturing timestamps of events. This schema serves as the foundation of dimensional modeling. A star schema forms when a fact table combines with its dimension tables.
Further, Snowflake enables easy integrations with numerous business intelligence tools, including PowerBI, Looker, and Tableau. Machine Learning Integration Opportunities Organizations harness machine learning (ML) algorithms to make forecasts on the data.
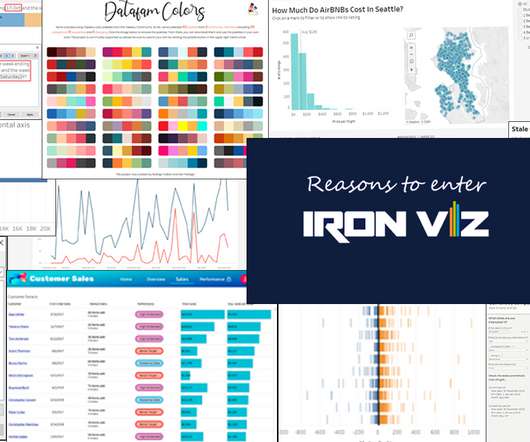
Technical Evangelist Director, Tableau. Hello, and welcome to Best of the Tableau Web! You’re building a bigger Tableau portfolio, too, which is great for a career in data analytics. The Tableau Community is a great resource for Iron Viz inspiration. Henry Mak, The Data School : Tableau Simples #8: Barcode Chart.
QGIS, Microsoft's Power BI, Tableau, and Jupyter notebooks also facilitated many interesting visualizations, particularly for solvers with less programming experience. Many participants used beginner-friendly online interfaces, like NASA Worldview and Giovanni , to explore and manipulate data.
Throughout the pandemic, Tableau has partnered with experts and organizations to help people around the world see and understand global COVID-19 data. With 400 million views and counting, our COVID-19 Data Hub has helped governments and organizations inform and guide decision-making. . April Doud. Solution Architect.
Technical Evangelist Director, Tableau. Hello, and welcome to Best of the Tableau Web! You’re building a bigger Tableau portfolio, too, which is great for a career in data analytics. The Tableau Community is a great resource for Iron Viz inspiration. Henry Mak, The Data School : Tableau Simples #8: Barcode Chart.
Throughout the pandemic, Tableau has partnered with experts and organizations to help people around the world see and understand global COVID-19 data. With 400 million views and counting, our COVID-19 Data Hub has helped governments and organizations inform and guide decision-making. . April Doud. Kristin Adderson. May 7, 2021.
Technical Fellow, Tableau. Innovation is necessary to use data effectively in the pursuit of a better world, particularly because data continues to increase in size and richness. I am proud to announce that my History of Tableau Innovation viz is now published to Tableau Public. Jock Mackinlay. Bronwen Boyd.
Technical Fellow, Tableau. Innovation is necessary to use data effectively in the pursuit of a better world, particularly because data continues to increase in size and richness. I am proud to announce that my History of Tableau Innovation viz is now published to Tableau Public. Jock Mackinlay. Bronwen Boyd.
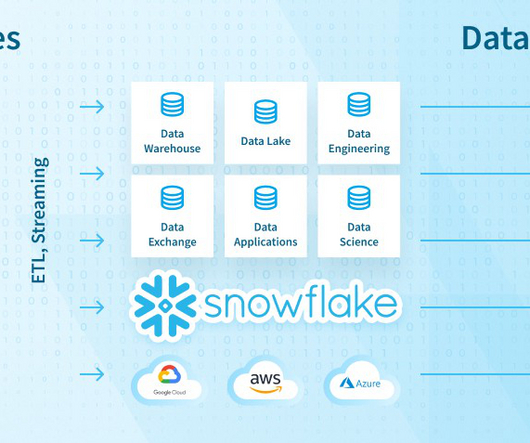
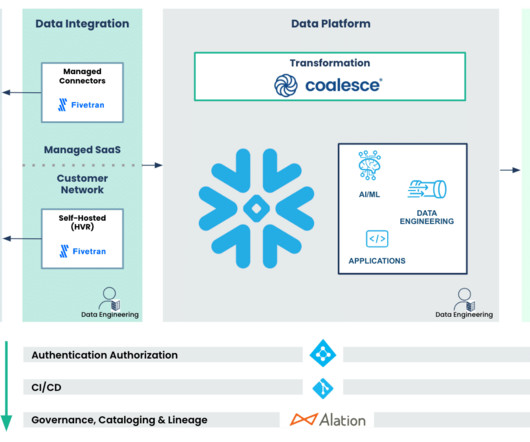
Data Mesh on Azure Cloud with Databricks and Delta Lake for Applications of Business Intelligence, Data Science and Process Mining. With the concept of Data Mesh you will be able to access all your organizational internal and external data sources once and provides the data as several datamodels for all your analytical applications.
Tableau (beta) Google Sheets (beta) Hex Klipfolio PowerMetrics Lightdash Mode Push.ai Delphi Prerequisites and Compatibility: It requires a dbt Cloud Team or Enterprise account and supports popular data warehouses like Snowflake, BigQuery, Databricks, and Redshift.
Built for integration, scalability, governance, and industry-leading security, Snowflake optimizes how you can leverage your organization’s data, providing the following benefits: Built to Be a Source of Truth Snowflake is built to simplify data integration wherever it lives and whatever form it takes.
We organize all of the trending information in your field so you don't have to. Join 17,000+ users and stay up to date on the latest articles your peers are reading.
You know about us, now we want to get to know you!
Let's personalize your content
Let's get even more personalized
We recognize your account from another site in our network, please click 'Send Email' below to continue with verifying your account and setting a password.


Let's personalize your content