This site uses cookies to improve your experience. To help us insure we adhere to various privacy regulations, please select your country/region of residence. If you do not select a country, we will assume you are from the United States. Select your Cookie Settings or view our Privacy Policy and Terms of Use.
Cookie Settings
Cookies and similar technologies are used on this website for proper function of the website, for tracking performance analytics and for marketing purposes. We and some of our third-party providers may use cookie data for various purposes. Please review the cookie settings below and choose your preference.
Used for the proper function of the website
Used for monitoring website traffic and interactions
Cookie Settings
Cookies and similar technologies are used on this website for proper function of the website, for tracking performance analytics and for marketing purposes. We and some of our third-party providers may use cookie data for various purposes. Please review the cookie settings below and choose your preference.
Strictly Necessary: Used for the proper function of the website
Performance/Analytics: Used for monitoring website traffic and interactions
Data is an essential component of any business, and it is the role of a data analyst to make sense of it all. PowerBI is a powerfuldata visualization tool that helps them turn raw data into meaningful insights and actionable decisions. Check out this course and learn PowerBI today!
When thinking about PowerBI , the platform’s visuals and report side immediately come to mind. While the front-end report visuals are important and the most visible to end users, a lot goes on behind the scenes that contribute heavily to the end product, including datamodeling. What is DataModeling?
Row-level security is a powerfuldata governance capability across many business intelligence platforms, and PowerBI is no exception. Learning how to implement row-level security is critical for any PowerBI developer hoping to add an extra layer of security to their reports and datasets.
Employing an analytical system in a data-driven business can help it to discover useful trends, information, conclusions and elevated decision making. PowerBI proves to be the best tool for analysis and visualization of data. Cloud-based PowerBI technology is a forerunner for corporate executives.
How to Optimize PowerBI and Snowflake for Advanced Analytics Spencer Baucke May 25, 2023 The world of business intelligence and data modernization has never been more competitive than it is today. Table of Contents Why Discuss Snowflake & PowerBI?
PowerBI Desktop enables the connection and retrieval of data from various sources, followed by data transformation using Power Query. To address this challenge, Microsoft introduced Dataflows within the PowerBI service. What are Dataflows in PowerBI?
In addition to Business Intelligence (BI), Process Mining is no longer a new phenomenon, but almost all larger companies are conducting this data-driven process analysis in their organization. The Event Log DataModel for Process Mining Process Mining as an analytical system can very well be imagined as an iceberg.
Data Analysis Expressions (DAX) is a language used in Analysis Services, PowerBI, and Power Pivot in Excel. Conclusion Data Analysis Expressions is a powerful language that can be used to perform advanced calculations and queries on data in Analysis Services, PowerBI , and Power Pivot in Excel.
Data Analysis Expressions (DAX) is a language used in Analysis Services, PowerBI, and Power Pivot in Excel. Conclusion Data Analysis Expressions is a powerful language that can be used to perform advanced calculations and queries on data in Analysis Services, PowerBI , and Power Pivot in Excel.
Specialized Industry Knowledge The University of California, Berkeley notes that remote data scientists often work with clients across diverse industries. Whether it’s finance, healthcare, or tech, each sector has unique data requirements.
Additionally, we will provide a distinction between measures and calculated columns in datamodeling and visualization. In PowerBI , the measure is used to calculate aggregations and percentages or when you require a single value for a group of rows. The measure name must be unique throughout the entire model.
Summary: PowerBI is a business analytics tool transforming data into actionable insights. Key features include AI-powered analytics, extensive data connectivity, customisation options, and robust datamodelling. Customisable dashboards and reports enhance data presentation. Why PowerBI?
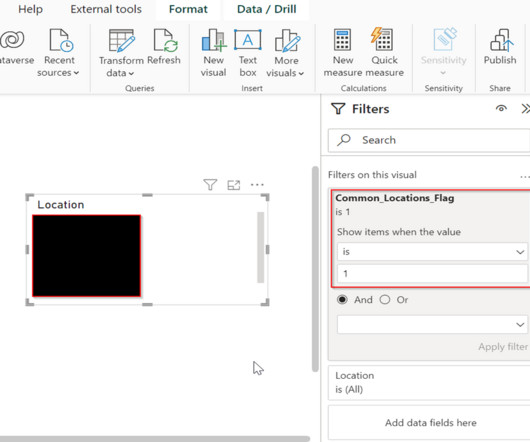
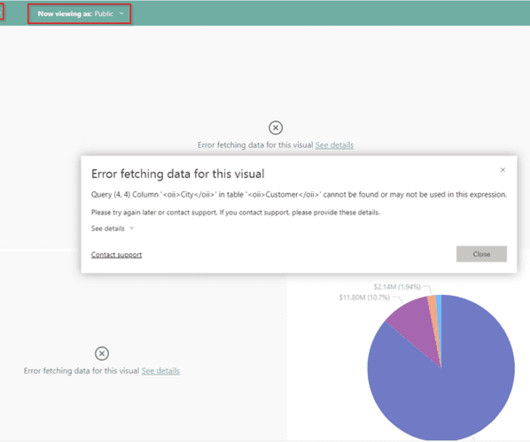
As PowerBI developers, we should be familiar with functionalities within PowerBI that allow for the implementation of various levels of data security; the most common example may be Row-Level Security (RLS). Perhaps this is because it is not a native feature readily available within PowerBI.
The Datamarts capability opens endless possibilities for organizations to achieve their data analytics goals on the PowerBI platform. Before we look into the PowerBI Datamarts, let us take a step back and understand the meaning of a Datamart. What is PowerBI Datamarts? What is a Datamart?
You can upload your data files to this GPT that it can then analyze. Once you provide relevant prompts of focus to the GPT, it can generate appropriate data visuals based on the information from the uploaded files. Other than the advanced data analysis, it can also deal with image conversions.
By the end of this blog, you should have a decent working knowledge of how Field Parameters can make your life as a PowerBI developer much easier. Field Parameters are a feature that equips users with the ability to toggle between multiple dimensions or values in a datamodel , thereby changing what is displayed on a visualization.
Summary: This blog dives into the most promising PowerBI projects, exploring advanced data visualization, AI integration, IoT & blockchain analytics, and emerging technologies. Discover best practices for successful implementation and propel your organization towards data-driven success.
The purpose of NLQ The main goal of NLQ is to democratize access to analytical tools, making it easier for users without a deep understanding of data management to derive insights. By simplifying the querying process, NLQ allows for quicker and more efficient information retrieval.
Summary: Counting rows is a fundamental task in PowerBI that requires careful consideration. This blog explores how to get total number of rows in power query. Understanding PowerBI and Its Importance PowerBI is a suite of business analytics tools that allows users to analyze data and share insights.
PowerBI Heatmap: Heatmap in PowerBI refers to the type of custom visualisation that businesses analysts utilise for showcasing the relationship between two variables on a map in different colour patches. It offers a wide range of features that make it a popular choice for data professionals, analysts, and organizations.
Summary: PowerBI alternatives like Tableau, Qlik Sense, and Zoho Analytics provide businesses with tailored Data Analysis and Visualisation solutions. Selecting the right alternative ensures efficient data-driven decision-making and aligns with your organisation’s goals and budget. What is PowerBI?
One critical tool for understanding and improving the urgent challenges facing our world is Earth observation (EO) data, meaning data that is gathered in outer space about life here on Earth! Earth observation data provides accurate and free information on our atmosphere, oceans, ecosystems, land cover, and built environment.
Summary: Big Data visualization involves representing large datasets graphically to reveal patterns, trends, and insights that are not easily discernible from raw data. Importance of Big Data Visualization The significance of Big Data Visualization lies in its ability to simplify complex datasets and facilitate decision-making.
PowerBI is a versatile and scalable platform that combines self-service and enterprise business intelligence (BI) capabilities. It serves as a comprehensive solution for connecting to diverse data sources and creating compelling visualizations. What is the SWITCH Function?
PowerBI Datamarts is one of the most exciting features that Microsoft has released for the Power Platform in recent years. If you need high-level information on what a PowerBI Datamart is and some example use cases, check out our other blog, What Are PowerBI Datamarts?
It makes them more versatile as they are not limited to handling textual information, but can process multimodal forms of data. Other data science tasks include data preprocessing, visualization, and statistical analysis. You can upload your data files to this GPT that it can then analyze.
It makes them more versatile as they are not limited to handling textual information, but can process multimodal forms of data. Other data science tasks include data preprocessing, visualization, and statistical analysis. You can upload your data files to this GPT that it can then analyze.
The current BI trends show that in the future, the BI software will be more accessible, so that even non-techie workers will rely on data insights in their working routine. This shows why self-service BI is on the rise. Using the information in making business predictions is not a new trend. Prescriptive Analytics.
These tools transform raw data into meaningful insights, helping businesses understand trends, monitor performance, and make informed decisions. There is a plethora of BI tools available in the market today, with new ones being added yearly. Selecting the right one can seem daunting.
In the digital era, data visualization stands as an indispensable tool in the realm of business intelligence. It represents the graphical display of data and information, transforming complex datasets into intuitive and understandable visuals. Extraneous elements can distract from the data you’re presenting.
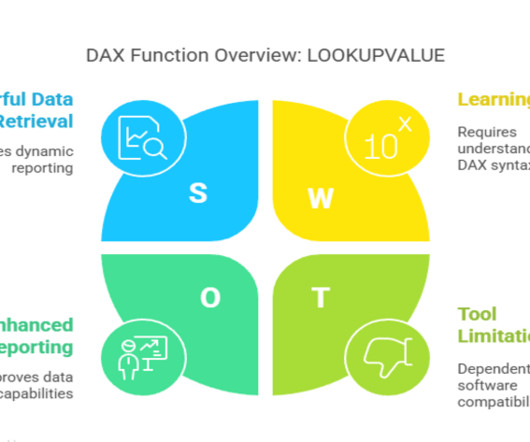
It helps retrieve values from tables based on specific conditions, making it a powerful tool for data analysis in PowerBI and Excel. By the end, you’ll have a solid grasp of how and when to leverage dax lookupvalue in your PowerBI reports or Excel Power Pivot models.
These tools transform raw data into actionable insights, enabling businesses to make informed decisions, improve operational efficiency, and adapt to market trends effectively. Introduction Business Intelligence (BI) tools are essential for organizations looking to harness data effectively and make informed decisions.
Business Intelligence (BI) refers to the technology, techniques, and practises that are used to gather, evaluate, and present information about an organisation in order to assist decision-making and generate effective administrative action. Based on the report of Zion Research, the global market of Business Intelligence rose from $16.33
To pursue a data science career, you need a deep understanding and expansive knowledge of machine learning and AI. js and Tableau Data science, data analytics and IBM Practicing data science isn’t without its challenges.
This role is vital for data-driven organizations seeking competitive advantages. Introduction We are living in an era defined by data. From customer interactions to market trends, every aspect of business generates a wealth of information. Essentially, BI bridges the gap between raw data and actionable knowledge.
Business intelligence (BI) has emerged as a key solution to help companies gain insights into their operations and market trends. BI involves using data mining, reporting, and querying techniques to identify key business metrics and KPIs that can help companies make informed decisions. According to the U.S.
Business intelligence (BI) has emerged as a key solution to help companies gain insights into their operations and market trends. BI involves using data mining, reporting, and querying techniques to identify key business metrics and KPIs that can help companies make informed decisions. According to the U.S.
Summary: Understanding Business Intelligence Architecture is essential for organizations seeking to harness data effectively. This framework includes components like data sources, integration, storage, analysis, visualization, and information delivery. They are useful for big data analytics where flexibility is needed.
For budding data scientists and data analysts, there are mountains of information about why you should learn R over Python and the other way around. Though both are great to learn, what gets left out of the conversation is a simple yet powerful programming language that everyone in the data science world can agree on, SQL.
The ever-growing tide of data continues to reshape the business landscape, demanding a new breed of professionals – the Data Analysts. These data detectives delve into the vast ocean of information, collecting, cleaning, and analyzing it to uncover hidden gems of knowledge. Enters: Tableau for Data Analyst.
Though seen in a variety of industries, including finance, eCommerce, marketing, healthcare, and government, a data analyst can be expected to perform analysis and interpretation of complex data to help organizations make informed decisions. But this doesn’t mean they’re off the hook on other programs.
Enrich data engineering skills by building problem-solving ability with real-world projects, teaming with peers, participating in coding challenges, and more. Globally several organizations are hiring data engineers to extract, process and analyze information, which is available in the vast volumes of data sets.
Importance of Tableau Tableau is used by different industries and organisations that helps in collecting large amount of datasets and therefore, using the data to interpret meaningful information. It further helps in understanding the information better and utilise it for effective decision-making.
We organize all of the trending information in your field so you don't have to. Join 17,000+ users and stay up to date on the latest articles your peers are reading.
You know about us, now we want to get to know you!
Let's personalize your content
Let's get even more personalized
We recognize your account from another site in our network, please click 'Send Email' below to continue with verifying your account and setting a password.


Let's personalize your content