This site uses cookies to improve your experience. To help us insure we adhere to various privacy regulations, please select your country/region of residence. If you do not select a country, we will assume you are from the United States. Select your Cookie Settings or view our Privacy Policy and Terms of Use.
Cookie Settings
Cookies and similar technologies are used on this website for proper function of the website, for tracking performance analytics and for marketing purposes. We and some of our third-party providers may use cookie data for various purposes. Please review the cookie settings below and choose your preference.
Used for the proper function of the website
Used for monitoring website traffic and interactions
Cookie Settings
Cookies and similar technologies are used on this website for proper function of the website, for tracking performance analytics and for marketing purposes. We and some of our third-party providers may use cookie data for various purposes. Please review the cookie settings below and choose your preference.
Strictly Necessary: Used for the proper function of the website
Performance/Analytics: Used for monitoring website traffic and interactions
Introduction PowerBI uses a set of functions, operators, and constants called DAX to perform dynamic computations and analysis. One can enhance their PowerBI competency by using DAX features that help in datamodeling and reporting.
Data is an essential component of any business, and it is the role of a data analyst to make sense of it all. PowerBI is a powerfuldata visualization tool that helps them turn raw data into meaningful insights and actionable decisions. How does a data analyst use PowerBI?
Summary: This PowerBI DAX tutorial introduces beginners to the fundamentals of Data Analysis Expressions, including syntax, functions, and context. It covers creating measures and calculated columns, using aggregate functions, and applying time intelligence for advanced Data Analysis. What is DAX?
When thinking about PowerBI , the platform’s visuals and report side immediately come to mind. While the front-end report visuals are important and the most visible to end users, a lot goes on behind the scenes that contribute heavily to the end product, including datamodeling. What is DataModeling?
Row-level security is a powerfuldata governance capability across many business intelligence platforms, and PowerBI is no exception. Learning how to implement row-level security is critical for any PowerBI developer hoping to add an extra layer of security to their reports and datasets.
Employing an analytical system in a data-driven business can help it to discover useful trends, information, conclusions and elevated decision making. PowerBI proves to be the best tool for analysis and visualization of data. Cloud-based PowerBI technology is a forerunner for corporate executives.
How to Optimize PowerBI and Snowflake for Advanced Analytics Spencer Baucke May 25, 2023 The world of business intelligence and data modernization has never been more competitive than it is today. Table of Contents Why Discuss Snowflake & PowerBI?
It offers full BI-Stack Automation, from source to data warehouse through to frontend. It supports a holistic datamodel, allowing for rapid prototyping of various models. It also supports a wide range of data warehouses, analytical databases, data lakes, frontends, and pipelines/ETL.
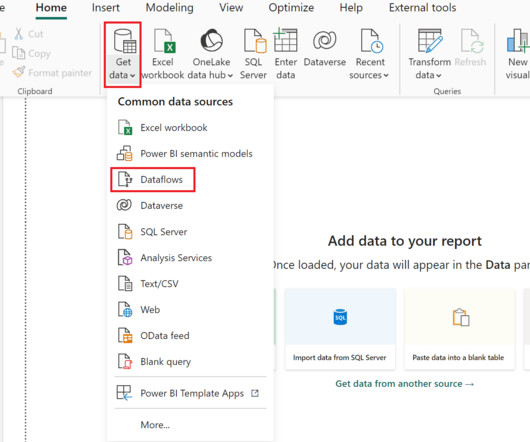
PowerBI Desktop enables the connection and retrieval of data from various sources, followed by data transformation using Power Query. To address this challenge, Microsoft introduced Dataflows within the PowerBI service. What are Dataflows in PowerBI?
Data Mesh on Azure Cloud with Databricks and Delta Lake for Applications of Business Intelligence, Data Science and Process Mining. With the concept of Data Mesh you will be able to access all your organizational internal and external data sources once and provides the data as several datamodels for all your analytical applications.
Additionally, we will provide a distinction between measures and calculated columns in datamodeling and visualization. In PowerBI , the measure is used to calculate aggregations and percentages or when you require a single value for a group of rows. The measure name must be unique throughout the entire model.
The Datamarts capability opens endless possibilities for organizations to achieve their data analytics goals on the PowerBI platform. Before we look into the PowerBI Datamarts, let us take a step back and understand the meaning of a Datamart. What is PowerBI Datamarts? What is a Datamart?
As PowerBI developers, we should be familiar with functionalities within PowerBI that allow for the implementation of various levels of data security; the most common example may be Row-Level Security (RLS). Perhaps this is because it is not a native feature readily available within PowerBI.
Summary: PowerBI is a leading data analytics platform offering advanced features like real-time analytics and collaborative capabilities. Understanding its significance is vital for aspiring PowerBI developers. Mastering PowerBI can significantly enhance career prospects, given its prevalence in the industry.
Summary: PowerBI is a business analytics tool transforming data into actionable insights. Key features include AI-powered analytics, extensive data connectivity, customisation options, and robust datamodelling. Customisable dashboards and reports enhance data presentation. Why PowerBI?
We at phData have written extensively about creating centralized data products in PowerBI. Most PowerBI developers are familiar with Power Query , Which is the data transformation layer of PowerBI. This step can be performed as many times as needed across as many datamodels.
By the end of this blog, you should have a decent working knowledge of how Field Parameters can make your life as a PowerBI developer much easier. Field Parameters are a feature that equips users with the ability to toggle between multiple dimensions or values in a datamodel , thereby changing what is displayed on a visualization.
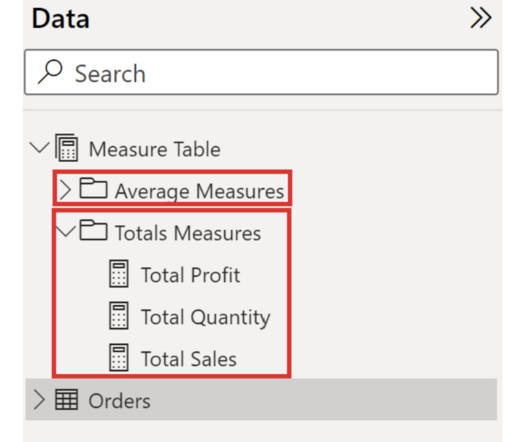
Letting your PowerBIdatamodel get disorganized is a feeling every PowerBI developer knows all too well, and it’s something that can occur very quickly when developing. One of the most common ways to organize the datamodel is to create a separate table exclusively for your measures.
Summary: This blog dives into the most promising PowerBI projects, exploring advanced data visualization, AI integration, IoT & blockchain analytics, and emerging technologies. Discover best practices for successful implementation and propel your organization towards data-driven success.
New big data architectures and, above all, data sharing concepts such as Data Mesh are ideal for creating a common database for many data products and applications. The Event Log DataModel for Process Mining Process Mining as an analytical system can very well be imagined as an iceberg.
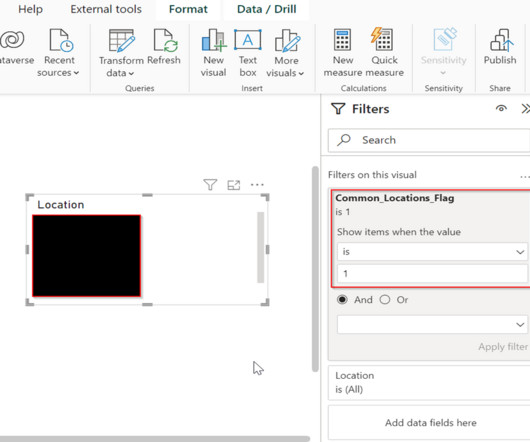
Data Analysis Expressions (DAX) is a language used in Analysis Services, PowerBI, and Power Pivot in Excel. FILTER : This function allows you to filter data based on a condition. By understanding the basics of DAX, you can create dynamic and informative reports that can help you make better decisions.
Data Analysis Expressions (DAX) is a language used in Analysis Services, PowerBI, and Power Pivot in Excel. FILTER : This function allows you to filter data based on a condition. By understanding the basics of DAX, you can create dynamic and informative reports that can help you make better decisions.
Summary: Counting rows is a fundamental task in PowerBI that requires careful consideration. This blog explores how to get total number of rows in power query. Understanding PowerBI and Its Importance PowerBI is a suite of business analytics tools that allows users to analyze data and share insights.
Summary: PowerBI alternatives like Tableau, Qlik Sense, and Zoho Analytics provide businesses with tailored Data Analysis and Visualisation solutions. Selecting the right alternative ensures efficient data-driven decision-making and aligns with your organisation’s goals and budget. What is PowerBI?
PowerBI Heatmap: Heatmap in PowerBI refers to the type of custom visualisation that businesses analysts utilise for showcasing the relationship between two variables on a map in different colour patches. It offers a wide range of features that make it a popular choice for data professionals, analysts, and organizations.
Using pre-production data during the development process of building a PowerBI dashboard is considered a best practice. Doing so avoids straining your production data environment and reserves those resources for dashboards that are actually being used by end-users. What can a Parameter for your Data Source Accomplish?
For instance, business analytics platforms like Microsoft PowerBI allow users to easily query data related to key performance metrics. Complex datamodeling The underlying data structures necessary for effective NLQ can be complex, requiring careful planning and architectural adjustments to ensure seamless performance.
Key Skills Proficiency in SQL is essential, along with experience in data visualization tools such as Tableau or PowerBI. Strong analytical skills and the ability to work with large datasets are critical, as is familiarity with datamodeling and ETL processes.
PowerBI is a versatile and scalable platform that combines self-service and enterprise business intelligence (BI) capabilities. It serves as a comprehensive solution for connecting to diverse data sources and creating compelling visualizations. What is the SWITCH Function?
PowerBI Datamarts is one of the most exciting features that Microsoft has released for the Power Platform in recent years. If you need high-level information on what a PowerBI Datamart is and some example use cases, check out our other blog, What Are PowerBI Datamarts?
It aims to provide a clear and concise representation of data. PowerBI Wizard It is a popular business intelligence tool that empowers you to explore data. The data exploration allows you to create reports, use DAX formulas for data manipulation, and suggest best practices for datamodeling.
Tableau is particularly strong in industries like finance, healthcare, and retail where data-driven decisions are crucial. Real-Time Data Monitoring : Allows users to track metrics in real-time. Google Charts Google Charts is a free tool that provides a simple way to visualise data on the web.
QGIS, Microsoft's PowerBI, Tableau, and Jupyter notebooks also facilitated many interesting visualizations, particularly for solvers with less programming experience. Many participants used beginner-friendly online interfaces, like NASA Worldview and Giovanni , to explore and manipulate data.
There is a plethora of BI tools available in the market today, with new ones being added yearly. Through a comparative analysis of some of the leading BI tools: Google Looker, Microsoft PowerBI, Tableau and Qlik Sense, discover which BI solution best fits your organization’s data analytics needs to empower informed decision-making.
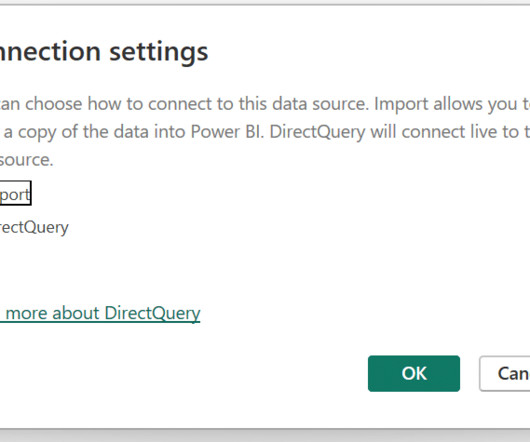
When connecting to data in PowerBI, you need to choose whether you want to use Import or Direct Query mode to connect to your data. Using the Import method, PowerBI captures and caches a snapshot of your data in PowerBI. What is PowerBI Direct Query?
And that is why: with BI you rely on a broader range of data, get deeper insights into the market, have a better vision of your companies strengths and weaknesses, receive trustworthy forecasts on business trends and get data-backed actionable tips on developing your business. SAP Lumira.
Effective Techniques for Data Visualization Let’s dive into the world of PowerBI to explore its features and learn some useful data visualization tips and tricks for data visualization. One of the most potent features of PowerBI is Quick Insights.
It aims to provide a clear and concise representation of data. PowerBI Wizard It is a popular business intelligence tool that empowers you to explore data. The data exploration allows you to create reports, use DAX formulas for data manipulation, and suggest best practices for datamodeling.
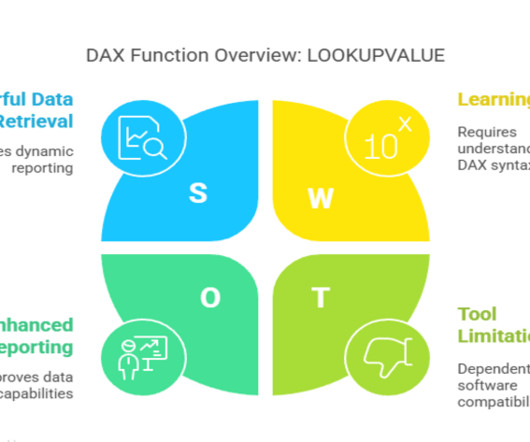
It helps retrieve values from tables based on specific conditions, making it a powerful tool for data analysis in PowerBI and Excel. By the end, you’ll have a solid grasp of how and when to leverage dax lookupvalue in your PowerBI reports or Excel Power Pivot models.
It aims to provide a clear and concise representation of data. PowerBI Wizard It is a popular business intelligence tool that empowers you to explore data. The data exploration allows you to create reports, use DAX formulas for data manipulation, and suggest best practices for datamodeling.
Key Takeaways Operations Analysts optimise efficiency through data-driven decision-making. Expertise in tools like PowerBI, SQL, and Python is crucial. Expertise in programs like Microsoft Excel, SQL , and business intelligence (BI) tools like PowerBI or Tableau allows analysts to process and visualise data efficiently.
Microsoft PowerBI Microsoft PowerBI integrates with various Microsoft products and offers robust reporting features. It is widely used by organizations such as Coca-Cola, which utilizes PowerBI to streamline its sales processes by analysing customer purchase trends and inventory levels.
It is the process of converting raw data into relevant and practical knowledge to help evaluate the performance of businesses, discover trends, and make well-informed choices. Data gathering, data integration, datamodelling, analysis of information, and data visualization are all part of intelligence for businesses.
We organize all of the trending information in your field so you don't have to. Join 17,000+ users and stay up to date on the latest articles your peers are reading.
You know about us, now we want to get to know you!
Let's personalize your content
Let's get even more personalized
We recognize your account from another site in our network, please click 'Send Email' below to continue with verifying your account and setting a password.


Let's personalize your content