This site uses cookies to improve your experience. To help us insure we adhere to various privacy regulations, please select your country/region of residence. If you do not select a country, we will assume you are from the United States. Select your Cookie Settings or view our Privacy Policy and Terms of Use.
Cookie Settings
Cookies and similar technologies are used on this website for proper function of the website, for tracking performance analytics and for marketing purposes. We and some of our third-party providers may use cookie data for various purposes. Please review the cookie settings below and choose your preference.
Used for the proper function of the website
Used for monitoring website traffic and interactions
Cookie Settings
Cookies and similar technologies are used on this website for proper function of the website, for tracking performance analytics and for marketing purposes. We and some of our third-party providers may use cookie data for various purposes. Please review the cookie settings below and choose your preference.
Strictly Necessary: Used for the proper function of the website
Performance/Analytics: Used for monitoring website traffic and interactions
There are also plenty of data visualization libraries available that can handle exploration like Plotly, matplotlib, D3, Apache ECharts, Bokeh, etc. In this article, we’re going to cover 11 data exploration tools that are specifically designed for exploration and analysis. Output is a fully self-contained HTML application.
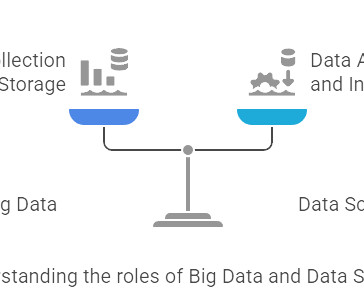
Semi-Structured Data: Data that has some organizational properties but doesn’t fit a rigid database structure (like emails, XML files, or JSON data used by websites). Unstructured Data: Data with no predefined format (like text documents, social media posts, images, audio files, videos).
I have checked the AWS S3 bucket and Snowflake tables for a couple of days and the Datapipeline is working as expected. The scope of this article is quite big, we will exercise the core steps of data science, let's get started… Project Layout Here are the high-level steps for this project. The data is in good shape.
As the algorithms we use have gotten more robust and we have increased our compute power through new technologies, we haven’t made nearly as much progress on the data part of our jobs. Because of this, I’m always looking for ways to automate and improve our datapipelines. So why should we use datapipelines?
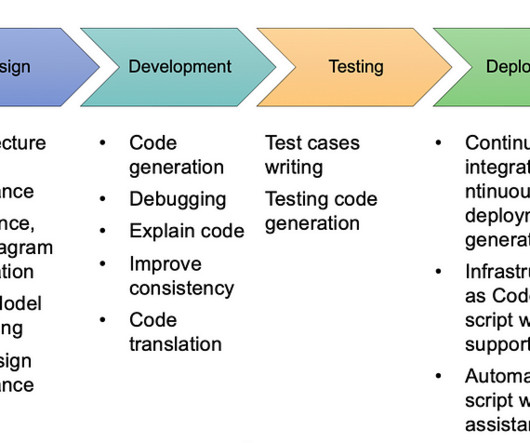
A typical SDLC has following stages: Stage1: Planning and requirement analysis, defining Requirements Gather requirement from end customer. Functional and non-functional requirements need to be documented clearly, which architecture design will be based on and support. The data would be interesting to analyze.
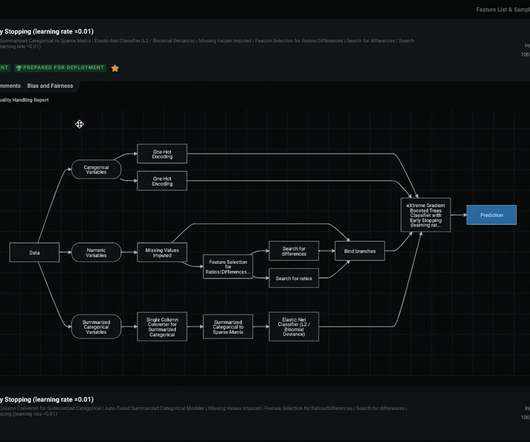
Ingest your data and DataRobot will use all these data points to train a model—and once it is deployed, your marketing team will be able to get a prediction to know if a customer is likely to redeem a coupon or not and why. All of this can be integrated with your marketing automation application of choice.
Documenting Objectives: Create a comprehensive document outlining the project scope, goals, and success criteria to ensure all parties are aligned. Making Data Stationary: Many forecasting models assume stationarity. accuracy, precision). Visualization tools can help in understanding these aspects better.
This section explores popular software and frameworks for DataAnalysis and modelling is designed to cater to the diverse needs of Data Scientists: Azure Data Factory This cloud-based data integration service enables the creation of data-driven workflows for orchestrating and automating data movement and transformation.
We organize all of the trending information in your field so you don't have to. Join 17,000+ users and stay up to date on the latest articles your peers are reading.
You know about us, now we want to get to know you!
Let's personalize your content
Let's get even more personalized
We recognize your account from another site in our network, please click 'Send Email' below to continue with verifying your account and setting a password.
Let's personalize your content