This site uses cookies to improve your experience. To help us insure we adhere to various privacy regulations, please select your country/region of residence. If you do not select a country, we will assume you are from the United States. Select your Cookie Settings or view our Privacy Policy and Terms of Use.
Cookie Settings
Cookies and similar technologies are used on this website for proper function of the website, for tracking performance analytics and for marketing purposes. We and some of our third-party providers may use cookie data for various purposes. Please review the cookie settings below and choose your preference.
Used for the proper function of the website
Used for monitoring website traffic and interactions
Cookie Settings
Cookies and similar technologies are used on this website for proper function of the website, for tracking performance analytics and for marketing purposes. We and some of our third-party providers may use cookie data for various purposes. Please review the cookie settings below and choose your preference.
Strictly Necessary: Used for the proper function of the website
Performance/Analytics: Used for monitoring website traffic and interactions
ArticleVideo Book This article was published as a part of the Data Science Blogathon. Introduction Visual analytics can tell the users the story of data. The post DataPreparation for Analysis : Towards Creating your Tableau Dashboard?—?Part Part 1 appeared first on Analytics Vidhya.
Introduction Data science has taken over all economic sectors in recent times. To achieve maximum efficiency, every company strives to use various data at every stage of its operations.
This article was published as a part of the Data Science Blogathon. Data Preprocessing: Datapreparation is critical in machine learning use cases. Data Compression is a big topic used in computer vision, computer networks, and many more. This is a more […].
My methods of using GPT-4 to optimize my datavisual workflow For the past 6 months, I have been a heavy daily GPT-4 user. I know it makes me sound like an addict, but I have found many good reasons and many excellent use cases where this tool is an invaluable resource for improving my data workflow.
Why do some embedded analytics projects succeed while others fail? We surveyed 500+ application teams embedding analytics to find out which analytics features actually move the needle. Read the 6th annual State of Embedded Analytics Report to discover new best practices. Brought to you by Logi Analytics.
These skills include programming languages such as Python and R, statistics and probability, machine learning, datavisualization, and data modeling. This includes sourcing, gathering, arranging, processing, and modeling data, as well as being able to analyze large volumes of structured or unstructured data.
The ML stack is an essential framework for any data scientist or machine learning engineer. With the ability to streamline processes ranging from datapreparation to model deployment and monitoring, it enables teams to efficiently convert raw data into actionable insights.
The primary aim is to make sense of the vast amounts of data generated daily by combining statistical analysis, programming, and datavisualization. It is divided into three primary areas: datapreparation, data modeling, and datavisualization.
This technological advancement not only empowers data analysts but also enables non-technical users to engage with data effortlessly, paving the way for enhanced insights and agile strategies. Augmented analytics is the integration of ML and NLP technologies aimed at automating several aspects of datapreparation and analysis.
Think your customers will pay more for datavisualizations in your application? But today, dashboards and visualizations have become table stakes. Five years ago they may have. Discover which features will differentiate your application and maximize the ROI of your embedded analytics. Brought to you by Logi Analytics.
Data is an essential component of any business, and it is the role of a data analyst to make sense of it all. Power BI is a powerful datavisualization tool that helps them turn raw data into meaningful insights and actionable decisions. Learn Power BI with this crash course in no time!
By utilizing algorithms and statistical models, data mining transforms raw data into actionable insights. The data mining process The data mining process is structured into four primary stages: data gathering, datapreparation, data mining, and data analysis and interpretation.
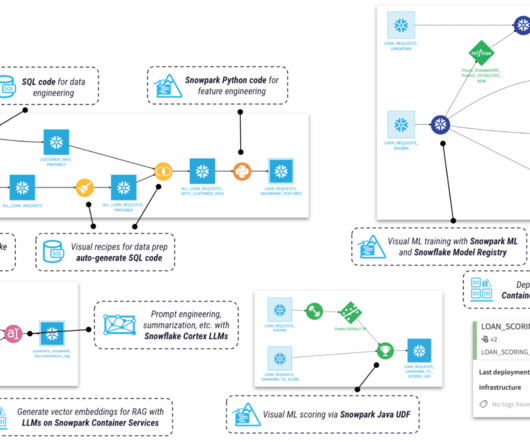
By providing a single, unified platform for data storage, management, and analysis, Snowflake connects organizations to leading software vendors specializing in analytics, machine learning, datavisualization, and more. One of the standout features of Dataiku is its focus on collaboration. Let’s say your company makes cars.
Big data processing With the increasing volume of data, big data technologies have become indispensable for Applied Data Science. DatavisualizationDatavisualization is the artwork of illustrating complicated facts in a graphical or pictorial format.
In the world of datavisualization , the ability to produce material that can speak to your audience, regardless of their technical expertise, is an ever-important factor to consider. Tableau Public Tableau Public , a powerful datavisualization software, empowers users to create interactive and shareable dashboards with ease.
It is a powerful tool that can be used to automate many of the tasks involved in data analysis, and it can also help businesses to discover new insights from their data. It has a wide range of machine 6: Tableau Tableau is a datavisualization software platform that can be used to create interactive dashboards and reports.
In the sales context, this ensures that sales data remains consistent, accurate, and easily accessible for analysis and reporting. Synapse Data Science: Synapse Data Science empowers data scientists to work directly with secured and governed sales dataprepared by engineering teams, allowing for the efficient development of predictive models.
It is a robust and powerful statistical software designed to help make data-driven decisions across different fields such as social science, policy-making, healthcare research and more. Many data analytics and data science experts know the individual strengths of IBM SPSS Statistics, R and Python.
This feature helps automate many parts of the datapreparation and data model development process. This significantly reduces the amount of time needed to engage in data science tasks. A text analytics interface that helps derive actionable insights from unstructured data sets.
Machine learning practitioners are often working with data at the beginning and during the full stack of things, so they see a lot of workflow/pipeline development, data wrangling, and datapreparation. What percentage of machine learning models developed in your organization get deployed to a production environment?
The platform employs an intuitive visual language, Alteryx Designer, streamlining datapreparation and analysis. With Alteryx Designer, users can effortlessly input, manipulate, and output data without delving into intricate coding, or with minimal code at most. What is Alteryx Designer?
These tools offer a wide range of functionalities to handle complex datapreparation tasks efficiently. The tool also employs AI capabilities for automatically providing attribute names and short descriptions for reports, making it easy to use and efficient for datapreparation.
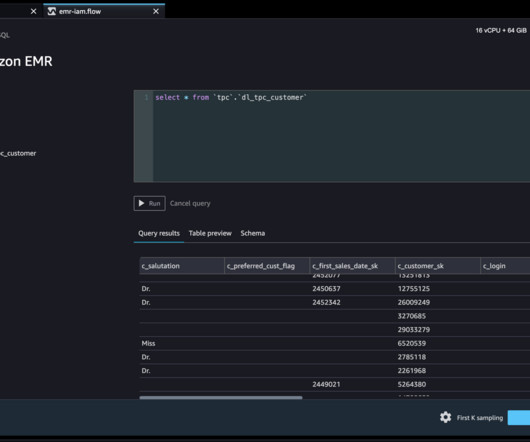
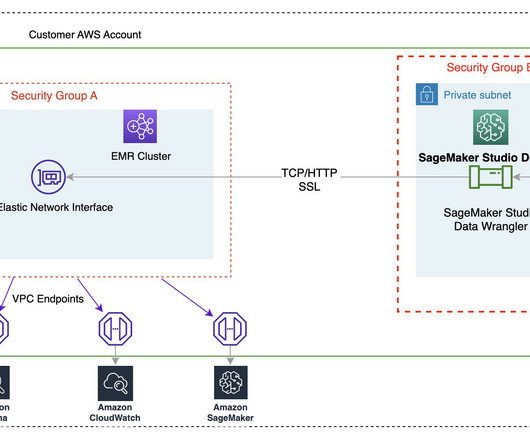
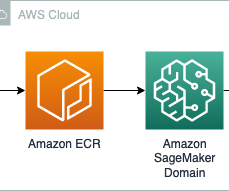
Snowflake is an AWS Partner with multiple AWS accreditations, including AWS competencies in machine learning (ML), retail, and data and analytics. You can import data from multiple data sources, such as Amazon Simple Storage Service (Amazon S3), Amazon Athena , Amazon Redshift , Amazon EMR , and Snowflake. Choose Open Studio.
Amazon SageMaker Data Wrangler reduces the time it takes to collect and preparedata for machine learning (ML) from weeks to minutes. We are happy to announce that SageMaker Data Wrangler now supports using Lake Formation with Amazon EMR to provide this fine-grained data access restriction. Choose Open Studio.
Imagine data scientists as modern-day detectives who sift through a sea of information to uncover hidden patterns, trends, and correlations that can inform decision-making and drive innovation. Just like sifting through ancient artifacts, they meticulously clean and refine the data, preparing it for the grand unveiling.
Amazon SageMaker Canvas is a low-code/no-code ML service that enables business analysts to perform datapreparation and transformation, build ML models, and deploy these models into a governed workflow. Analysts can perform the same actions in SageMaker Canvas using the visual interface. csv dataset into SageMaker Canvas.
KNIME Analytics Platform is an open-source data analytics tool that enables users to manage, process, and analyze data through a visual, user-friendly interface. While both these tools are powerful on their own, their combined strength offers a comprehensive solution for data analytics.
Finally, they can also train and deploy models with SageMaker Autopilot , schedule jobs, or operationalize datapreparation in a SageMaker Pipeline from Data Wrangler’s visual interface. Solution overview With SageMaker Studio setups, data professionals can quickly identify and connect to existing EMR clusters.
Here, the visual encoder’s weights are frozen, while the projection layer and language model are updated. The dataset we created consists of image-text pairs, with each image being an infographic, chart, or other datavisualization.
Offering features like TensorBoard for datavisualization and TensorFlow Extended (TFX) for implementing production-ready ML pipelines, TensorFlow stands out as a comprehensive solution for both beginners and seasoned professionals in the realm of machine learning.
KNIME Analytics Platform is an open-source data analytics tool that enables users to manage, process, and analyze data. Microsoft Power BI has established itself as a premier datavisualization product used to turn unrelated data sources into coherent, visually immersive, and interactive insights.
Summary: This blog dives into the most promising Power BI projects, exploring advanced datavisualization, AI integration, IoT & blockchain analytics, and emerging technologies. Discover best practices for successful implementation and propel your organization towards data-driven success.
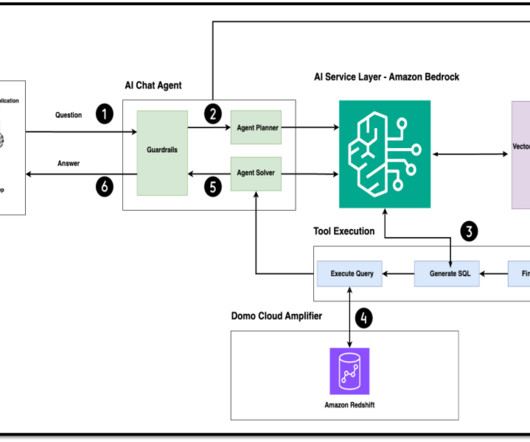
Domo works with organizations that place a strong emphasis on deriving actionable insights from their data assets. Domo’s existing solution already enables these organizations to extract valuable insights through datavisualization and analysis. powered by Amazon Bedrock Domo.AI
Data Literacy—Many line-of-business people have responsibilities that depend on data analysis but have not been trained to work with data. Their tendency is to do just enough data work to get by, and to do that work primarily in Excel spreadsheets. Who needs data literacy training? Who can provide the training?
In this blog, we’ll explain why you should prepare your data before use in machine learning , how to clean and preprocess the data, and a few tips and tricks about datapreparation. Why PrepareData for Machine Learning Models? It may hurt it by adding in irrelevant, noisy data.
Step 1: Data Collection and Preparation The first step in EDA is to collect the data and prepare it for analysis. This involves cleaning and transforming the data into a format that can be analyzed. Some common datapreparation tasks include removing missing values, checking for outliers, and normalizing the data.
In the recent Gartner Peer Insights ‘Voice of the Customer’: DataPreparation Tools report , Tableau is the only vendor recognized in the Gartner Peer Insights Customers’ Choice distinction across all regions, company sizes, and industries—including the sole Customers’ Choice by users in the finance vertical. .
Benefits of PCA Here’s why PCA is a valuable tool for beginners venturing into data analysis: Simplifies complex data PCA reduces clutter by identifying the most significant features, making datavisualization and interpretation more manageable. Data cleaning : Handle missing values and outliers if necessary.
Let’s begin with the datapreparation in the required format for the same. By following our step-by-step guide and implementing our expert tips, you will be well-equipped to create impactful charts that effectively convey complex financial data. So, give it a try and unlock the power of datavisualization with Excel.
Youll gain immediate, practical skills in Python, datapreparation, machine learning modeling, and retrieval-augmented generation (RAG), all leading up to AI Agents. Each course features focused, interactive sessions with hands-on notebooks and exercises, along with dedicated office hours. Learn more about the AI Mini Bootcamphere.
First and foremost, Studio makes it easier to share notebook assets across a large team of data scientists like the one at Boomi. Boomi’s analysts were free to use SageMaker Data Wrangler for datapreparation tasks, while Boomi’s data scientists could continue to use Jupyter notebooks.
Learn how Data Scientists use ChatGPT, a potent OpenAI language model, to improve their operations. ChatGPT is essential in the domains of natural language processing, modeling, data analysis, data cleaning, and datavisualization. This will enhance the datapreparation stage of machine learning.
Data preprocessing and feature engineering In this section, we discuss our methods for datapreparation and feature engineering. Datapreparation To extract data efficiently for training and testing, we utilize Amazon Athena and the AWS Glue Data Catalog.
DataPreparation for Demand Forecasting High-quality data is the cornerstone of effective demand forecasting. Just like building a house requires a strong foundation, building a reliable forecast requires clean and well-organized data. If your data exhibits seasonal patterns (e.g.,
We organize all of the trending information in your field so you don't have to. Join 17,000+ users and stay up to date on the latest articles your peers are reading.
You know about us, now we want to get to know you!
Let's personalize your content
Let's get even more personalized
We recognize your account from another site in our network, please click 'Send Email' below to continue with verifying your account and setting a password.


Let's personalize your content