This site uses cookies to improve your experience. To help us insure we adhere to various privacy regulations, please select your country/region of residence. If you do not select a country, we will assume you are from the United States. Select your Cookie Settings or view our Privacy Policy and Terms of Use.
Cookie Settings
Cookies and similar technologies are used on this website for proper function of the website, for tracking performance analytics and for marketing purposes. We and some of our third-party providers may use cookie data for various purposes. Please review the cookie settings below and choose your preference.
Used for the proper function of the website
Used for monitoring website traffic and interactions
Cookie Settings
Cookies and similar technologies are used on this website for proper function of the website, for tracking performance analytics and for marketing purposes. We and some of our third-party providers may use cookie data for various purposes. Please review the cookie settings below and choose your preference.
Strictly Necessary: Used for the proper function of the website
Performance/Analytics: Used for monitoring website traffic and interactions
By utilizing algorithms and statistical models, data mining transforms raw data into actionable insights. The data mining process The data mining process is structured into four primary stages: data gathering, datapreparation, data mining, and data analysis and interpretation.
The platform employs an intuitive visual language, Alteryx Designer, streamlining datapreparation and analysis. With Alteryx Designer, users can effortlessly input, manipulate, and output data without delving into intricate coding, or with minimal code at most.
DataPreparation for Demand Forecasting High-quality data is the cornerstone of effective demand forecasting. Just like building a house requires a strong foundation, building a reliable forecast requires clean and well-organized data. If your data exhibits seasonal patterns (e.g.,
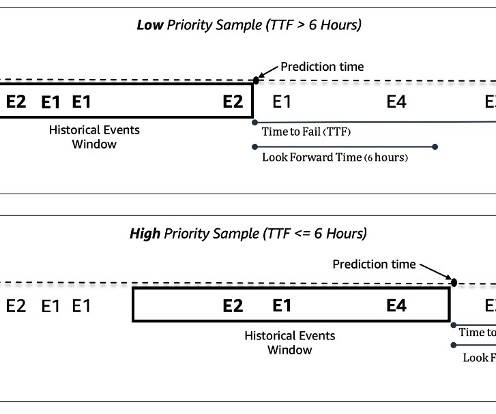
Data preprocessing and feature engineering In this section, we discuss our methods for datapreparation and feature engineering. Datapreparation To extract data efficiently for training and testing, we utilize Amazon Athena and the AWS Glue Data Catalog.
DecisionTrees ML-based decisiontrees are used to classify items (products) in the database. This is the applied machine learning algorithm that works with tabular and structured data. In its core, lie gradient-boosted decisiontrees. Datavisualization charts and plot graphs can be used for this.
Visualising data makes it easier to identify anomalies and understand distributions. More to read: How is DataVisualization helpful in Business Analytics? It’s critical in harnessing data insights for decision-making, empowering businesses with accurate forecasts and actionable intelligence.
Machine learning algorithms Machine learning forms the core of Applied Data Science. It leverages algorithms to parse data, learn from it, and make predictions or decisions without being explicitly programmed.
Augmented Analytics Augmented analytics is revolutionising the way businesses analyse data by integrating Artificial Intelligence (AI) and Machine Learning (ML) into analytics processes. Dive Deep into Machine Learning and AI Technologies Study core Machine Learning concepts, including algorithms like linear regression and decisiontrees.
We organize all of the trending information in your field so you don't have to. Join 17,000+ users and stay up to date on the latest articles your peers are reading.
You know about us, now we want to get to know you!
Let's personalize your content
Let's get even more personalized
We recognize your account from another site in our network, please click 'Send Email' below to continue with verifying your account and setting a password.


Let's personalize your content